
Compare Kesar Petroprod. with Similar Stocks
Dashboard
Low ability to service debt as the company has a high Debt to EBITDA ratio of 3.45 times
- Poor long term growth as Net Sales has grown by an annual rate of 8.95% over the last 5 years
- Low ability to service debt as the company has a high Debt to EBITDA ratio of 3.45 times
- The company has been able to generate a Return on Equity (avg) of 3.67% signifying low profitability per unit of shareholders funds
Negative results in Mar 26
Underperformed the market in the last 1 year
Stock DNA
Commodity Chemicals
INR 204 Cr (Micro Cap)
21.00
23
0.00%
0.39
6.47%
1.34
Total Returns (Price + Dividend) 
Latest dividend: 0.1 per share ex-dividend date: Sep-24-2015
Risk Adjusted Returns v/s
Returns Beta

News

Kesar Petroproducts Ltd is Rated Strong Sell
Kesar Petroproducts Ltd is rated Strong Sell by MarketsMOJO, with this rating last updated on 29 May 2026. However, the analysis and financial metrics discussed here reflect the stock’s current position as of 23 June 2026, providing investors with the latest insights into the company’s performance and outlook.
Read full news article
Kesar Petroproducts Ltd is Rated Strong Sell
Kesar Petroproducts Ltd is rated Strong Sell by MarketsMOJO, with this rating last updated on 29 May 2026. However, the analysis and financial metrics discussed here reflect the stock’s current position as of 12 June 2026, providing investors with the most recent and relevant data to assess the company’s outlook.
Read full news article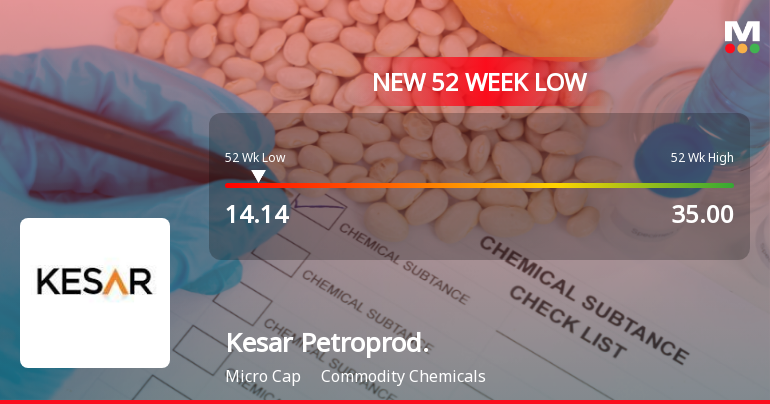
Kesar Petroproducts Ltd Falls to 52-Week Low of Rs 14.14 as Sell-Off Deepens
For the fifth consecutive session, Kesar Petroproducts Ltd closed lower, slipping to a fresh 52-week low of Rs 14.14 on 8 Jun 2026. This decline comes amid a broader market environment where the Sensex itself is hovering near its own 52-week low, yet the stock’s underperformance remains notably severe.
Read full news article Announcements
Announcement under Regulation 30 (LODR)-Allotment
08-Jun-2026 | Source : BSEAllotment of 15000000 Equity Shares to Promoter Group category Upon Excercising option on conversion of the convertable warrants
Company Update Cancellation Of Warrants.
08-Jun-2026 | Source : BSE1. Allotment of 15000000 Equity Shares to Promoter Group Category upon Exercising Opon on Conversion of the Convertable Warrants. 2. Forfeiture of 25% Upfront Money Received against Non Exercised Convertable warrants and Cancellation of Warrants.
Board Meeting Outcome for Outcome Of The Meeting Of The Board Of Directors Of The Company Held On June 08 2026.
08-Jun-2026 | Source : BSE1. Allotment of 15000000 Equity Shares to Promoter Group Category upon Exercising Option on Conversion of the Convertible Warrants 2. Forfeiture of 25% Upfront Money Received Against Non-Exercised Convertible Warrants and Cancellation of Warrants
Corporate Actions

No Upcoming Board Meetings

Kesar Petroproducts Ltd has declared 10% dividend, ex-date: 24 Sep 15

Kesar Petroproducts Ltd has announced 1:10 stock split, ex-date: 30 Oct 15

No Bonus history available

No Rights history available
Quality key factors
Valuation key factors
Technicals key factors
 Technical Indicator Scale: Bearish, Mildly Bearish, Sideways, Mildly Bullish, Bullish Turned
 Shareholding Snapshot : Mar 2026
Shareholding Compare (%holding)
Promoters
None
Held by 4 Schemes (0.01%)
Held by 0 FIIs
Dinesh Sharma Huf (30.41%)
Rajkumar (5.17%)
30.03%
Quarterly Results Snapshot (Standalone) - Mar'26 - QoQ

QoQ Growth in quarter ended Mar 2026 is 13.29% vs -18.29% in Dec 2025

QoQ Growth in quarter ended Mar 2026 is -273.29% vs -50.68% in Dec 2025
Half Yearly Results Snapshot (Standalone) - Sep'25
Growth in half year ended Sep 2025 is 5.51% vs 48.83% in Sep 2024
Growth in half year ended Sep 2025 is 134.52% vs 1,020.00% in Sep 2024
Nine Monthly Results Snapshot (Standalone) - Dec'25
YoY Growth in nine months ended Dec 2025 is -2.38% vs 45.23% in Dec 2024
YoY Growth in nine months ended Dec 2025 is 84.71% vs 315.63% in Dec 2024
Annual Results Snapshot (Standalone) - Mar'26
YoY Growth in year ended Mar 2026 is 1.11% vs 24.38% in Mar 2025
YoY Growth in year ended Mar 2026 is -2.81% vs 100.40% in Mar 2025
About Kesar Petroproducts Ltd

Company Coordinates


