Perfectpac

  • Market Cap: Micro Cap
  • Industry: Paper, Forest & Jute Products
  • ISIN: INE759I01024
  • NSEID:
  • BSEID: 526435
INR
73.99
3.09 (4.36%)
BSENSE

Jul 15, 01:04 PM

BSE+NSE Vol: 310

  • Price Points
  • Score
  • Mojo Parameters
  • Total Return
  • News and Corporate Actions
  • Key factors
  • Shareholding
  • Financials
  • CompanyCV
stock-summaryPrice Point
High/Low

1Day

52 Week

Valuation
Technical
Day's Volume

CASH

310 (365.47%) Volume

Shareholding (Jun 2026)

FII

0.00%

Held by 0 FIIs

DII

0.06%

Held by 0 DIIs

Promoter

74.83%

Why is Perfectpac Ltd falling/rising?

15-Jul-2026

As of 14-Jul, Perfectpac Ltd's stock price is rising to Rs 70.90, up 2.68% today, but it has underperformed over the past year with a return of -39.89%. Despite today's gains, the stock shows weak long-term fundamentals and declining investor confidence.

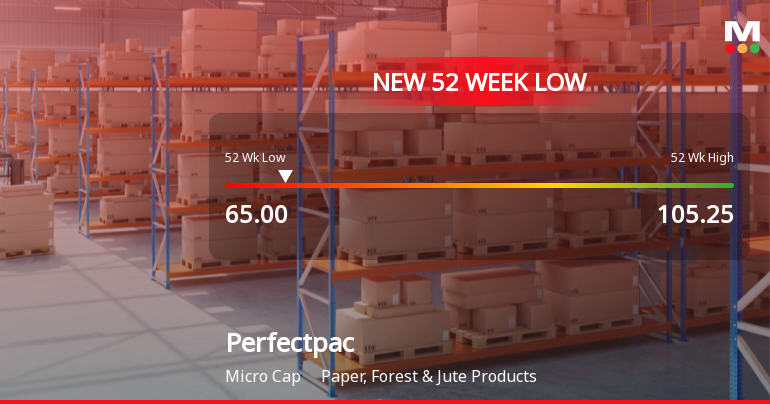
As of 14-Jul, Perfectpac Ltd's stock price is rising, currently at Rs 70.90, reflecting a change of 1.85 (2.68%) upward. This rise is notable as the stock has outperformed its sector by 2.71% today, despite opening with a loss of -2.1%. The stock reached an intraday high of Rs 72.42, indicating some positive trading momentum during the day.<BR><BR>However, it is important to consider the broader context of the stock's performance. Over the past year, Perfectpac Ltd has generated a return of -39.89%, significantly underperforming against the benchmark, which has seen a decline of only -6.32%. Additionally, the stock has been trading below its moving averages across various time frames, indicating a generally weak trend.<BR><BR>Investor participation has also been declining, with delivery volume falling by -25.33% compared to the 5-day average. This suggests a lack of confidence among investors, which could be a contributing factor to the stock's overall volatility.<BR><BR>In summary, while there is a short-term rise in the stock price today, the long-term fundamentals and recent trading patterns indicate ongoing challenges for Perfectpac Ltd, including weak growth and consistent underperformance against benchmarks.

View full answer

What does Perfectpac do?

11-Jun-2026

Perfectpac Ltd is a manufacturer of corrugated fiberboard containers and Expanded Polystyrene products, established in 1973 and based in Northern India. As of March 2026, it reported net sales of 30 Cr and a net profit of 1 Cr, with a market cap of INR 45 Cr.

Overview:<BR>Perfectpac Ltd is a manufacturer of corrugated fiberboard containers and Expanded Polystyrene products, operating in the Paper, Forest & Jute Products industry within the micro-cap market.<BR><BR>History:<BR>Perfectpac Ltd was incorporated in 1973 and has established itself as one of the largest manufacturers of corrugated fiberboard containers in Northern India. The company diversified into the manufacture of Expanded Polystyrene products in 1996 and set up a second unit in Greater Noida in 2000. The latest quarterly results reported net sales and net profit for March 2026.<BR><BR>Financial Snapshot:<BR>Net Sales: 30 Cr (Quarterly Results - Mar 2026) <BR>Net Profit: 1 Cr (Quarterly Results - Mar 2026) <BR>Market Cap: INR 45 Cr (Micro Cap)<BR><BR>Key Metrics:<BR>P/E: 14.00 <BR>Industry P/E: 18 <BR>Dividend Yield: 1.48% <BR>Debt Equity: 0.07 <BR>Return on Equity: 8.20% <BR>Price to Book: 1.14 <BR><BR>Contact Details:<BR>Address: 910 Chiranjiv Tower, 43 Nehru Place New Delhi New Delhi : 110019 <BR>Tel: 91-11-26441015/16/17 <BR>Email: amehta@perfectpac.com <BR>Website: http://www.perfectpac.com

View full answer

How big is Perfectpac?

11-Jun-2026

As of 10th June, Perfectpac Ltd has a market capitalization of 45.00 Cr, with recent Net Sales of 113.74 Cr and a Net Profit of 3.14 Cr. Shareholder's Funds are 37.53 Cr and Total Assets amount to 49.85 Cr.

As of 10th June, Perfectpac Ltd has a market capitalization of 45.00 Cr, categorizing it as a Micro Cap company.<BR><BR>In the latest four quarters, Perfectpac reported Net Sales of 113.74 Cr and a Net Profit of 3.14 Cr.<BR><BR>The latest annual period for the balance sheet is March 2025, with Shareholder's Funds amounting to 37.53 Cr and Total Assets of 49.85 Cr.

View full answer

Who are in the management team of Perfectpac?

11-Jun-2026

The management team of Perfectpac includes R K Rajgarhia (Chairman & Director), Sanjay Rajgarhia (Managing Director), Harpal Singh Chawla, Ruchi Vij, and Manish Garg (Independent Directors), Raj Gopal Sharma (Whole-time Director), and Nidhi (Company Secretary & Compliance Officer).

The management team of Perfectpac includes the following individuals:<BR><BR>1. R K Rajgarhia - Chairman & Director<BR>2. Sanjay Rajgarhia - Managing Director<BR>3. Harpal Singh Chawla - Independent Director<BR>4. Ruchi Vij - Independent Director<BR>5. Manish Garg - Independent Director<BR>6. Raj Gopal Sharma - Whole-time Director<BR>7. Nidhi - Company Secretary & Compliance Officer<BR><BR>If you need more details about any specific member or their roles, feel free to ask!

View full answer

Who are the peers of the Perfectpac?

11-Jun-2026

Perfectpac's peers include Nath Industries, Ganga Papers, Balkrishna Paper, and others, with varying management risks and growth rates. Grameva leads in 1-year returns at 53.90%, while Perfectpac's return is -41.81%.

Peers: The peers of Perfectpac are Nath Industries, Ganga Papers, Balkrishna Paper, Malu Paper, Three M Paper, Spinaroo Comm., Pratik Panels, Mohit Paper Mill, and Kay Power &Paper.<BR><BR>Quality Snapshot: Excellent management risk is observed at Pratik Panels, while Average management risk is found at Nath Industries, Ganga Papers, Spinaroo Comm., and Kay Power &Paper. Below Average management risk is noted at Three M Paper and Mohit Paper Mill, and the rest have either does not qualify or are not rated. Growth is Good at Pratik Panels and Grameva, Average at Perfectpac, and Below Average at Nath Industries, Ganga Papers, Three M Paper, Spinaroo Comm., and Kay Power &Paper. The rest do not qualify for growth. Capital Structure is Good at Pratik Panels, Average at Perfectpac and Kay Power &Paper, and Below Average at Nath Industries, Ganga Papers, Three M Paper, Spinaroo Comm., and Mohit Paper Mill, while the rest do not qualify.<BR><BR>Return Snapshot: The peer with the highest 1-year return is Grameva at 53.90%, while the peer with the lowest is Nath Industries at -44.56%. Perfectpac's 1-year return is -41.81%, which is higher than Nath Industries but lower than Grameva. Additionally, several peers, including Nath Industries, Ganga Papers, Malu Paper, Three M Paper, Kay Power &Paper, and others, have negative six-month returns.

View full answer

Are Perfectpac Ltd latest results good or bad?

14-May-2026

Perfectpac Ltd's latest results are concerning, showing a sequential revenue recovery but a year-on-year decline, with operating margins contracting and a low return on equity. Overall, the financial performance indicates significant operational challenges, leading to a "Strong Sell" rating.

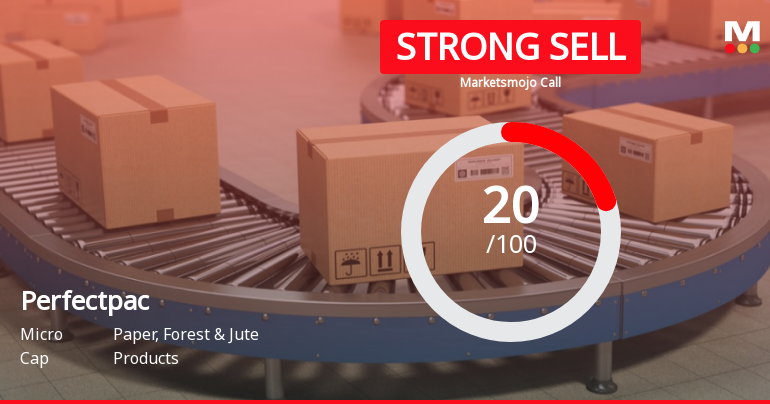
Perfectpac Ltd's latest results present a mixed picture, leaning towards the negative side. While the company experienced an 18.36% sequential revenue recovery to ₹29.65 crores in Q4 FY26 from ₹25.05 crores in Q3 FY26, this figure still reflects a 6.20% decline compared to ₹31.61 crores in the same quarter last year (Q4 FY25). <BR><BR>Operating margins have significantly contracted to 5.40%, down from 7.53% in the previous quarter, indicating increasing cost pressures that the company is facing in the paper packaging sector. Although net profit rose to ₹0.77 crores, marking a 13.24% year-on-year increase, the overall financial performance suggests persistent challenges. <BR><BR>The company's return on equity (ROE) of 8.34% is below average for the manufacturing sector, raising concerns about its capital efficiency. Additionally, the stock is trading 31.73% below its 52-week high, and its Mojo Score is low at 23 out of 100, indicating a "Strong Sell" rating. <BR><BR>In summary, while there are some signs of recovery in terms of sequential revenue growth, the year-on-year decline, margin compression, and weak return ratios highlight significant operational challenges, making the latest results appear more concerning than positive.

View full answer

Should I buy, sell or hold Perfectpac Ltd?

14-May-2026

Is Perfectpac overvalued or undervalued?

05-Dec-2025

As of December 4, 2025, Perfectpac is considered undervalued with a valuation grade upgrade to attractive, featuring a PE Ratio of 15.62, an EV to EBITDA of 7.98, and a ROE of 9.60%, while its year-to-date stock performance has declined by 40.56% compared to the Sensex's 9.12%, although it has achieved a long-term gain of 256.61% over five years.

As of 4 December 2025, Perfectpac's valuation grade has moved from fair to attractive, indicating a positive shift in its perceived value. The company is currently assessed as undervalued. Key ratios include a PE Ratio of 15.62, an EV to EBITDA of 7.98, and a ROE of 9.60%. <BR><BR>In comparison to its peers, Perfectpac's PE Ratio is notably lower than Garware Hi Tech's 27.33, which is classified as very expensive, while it is more favorable than AGI Greenpac's PE of 13.84, which is also attractive. The company's recent stock performance has lagged behind the Sensex, with a year-to-date return of -40.56% compared to the Sensex's 9.12%, but its long-term performance over five years shows a significant gain of 256.61%.

View full answer

How has been the historical performance of Perfectpac?

09-Nov-2025

Perfectpac has shown steady growth in net sales and total operating income, increasing from 65.90 Cr in Mar'21 to 113.46 Cr in Mar'25, while profit before tax rose to 4.25 Cr despite a decline from the previous year. However, rising raw material costs impacted operating profit, and cash flow from operating activities decreased significantly.

Answer:<BR>The historical performance of Perfectpac shows a steady growth in net sales and total operating income over the years, with net sales increasing from 65.90 Cr in Mar'21 to 113.46 Cr in Mar'25. The total operating income followed a similar trend, rising from 65.90 Cr in Mar'21 to 113.46 Cr in Mar'25. However, the raw material costs also increased significantly, from 47.49 Cr in Mar'21 to 80.04 Cr in Mar'25, impacting the operating profit, which decreased from 7.14 Cr in Mar'24 to 6.43 Cr in Mar'25. Despite this, the profit before tax showed an upward trend from 1.08 Cr in Mar'21 to 4.25 Cr in Mar'25, although it declined from 5.24 Cr in Mar'24. The profit after tax also increased from 0.77 Cr in Mar'21 to 3.15 Cr in Mar'25, despite a drop from 3.98 Cr in Mar'24. The company's total assets grew from 35.57 Cr in Mar'20 to 49.85 Cr in Mar'25, while total liabilities increased from 35.57 Cr in Mar'20 to 49.85 Cr in Mar'25, indicating a consistent growth in both assets and liabilities. The cash flow from operating activities decreased from 8.00 Cr in Mar'24 to 4.00 Cr in Mar'25, reflecting a decline in cash generation capacity.<BR><BR>Breakdown:<BR>Perfectpac's financial performance over the years reveals a significant increase in net sales, which rose from 65.90 Cr in Mar'21 to 113.46 Cr in Mar'25, indicating strong revenue growth. Total operating income mirrored this trend, climbing from 65.90 Cr to 113.46 Cr during the same period. However, the rise in raw material costs, which escalated from 47.49 Cr to 80.04 Cr, adversely affected the operating profit, leading to a decrease from 7.14 Cr in Mar'24 to 6.43 Cr in Mar'25. Despite this, the profit before tax increased from 1.08 Cr in Mar'21 to 4.25 Cr in Mar'25, although it saw a decline from the previous year. Profit after tax also showed growth, moving from 0.77 Cr to 3.15 Cr, despite a drop from 3.98 Cr in Mar'24. The company's total assets expanded from 35.57 Cr in Mar'20 to 49.85 Cr in Mar'25, while total liabilities grew correspondingly, reflecting a balanced growth in both areas. However, cash flow from operating activities decreased from 8.00 Cr in Mar'24 to 4.00 Cr in Mar'25, indicating challenges in cash generation.

View full answer

Who are the top shareholders of the Perfectpac?

17-Jul-2025

The top shareholder of Perfectpac is Sanjay Rajgarhia, who holds 51.63% of the shares. The highest public shareholder is Bhavna Govindbhai Desai with 2%, while individual investors collectively own 24.22% of the company.

The top shareholders of Perfectpac include the promoters, with Sanjay Rajgarhia holding the largest share at 51.63%. There are no pledged promoter holdings, and mutual funds and foreign institutional investors do not hold any shares in the company. The highest public shareholder is Bhavna Govindbhai Desai, who owns 2% of the shares. Additionally, individual investors collectively hold 24.22% of the company's shares.

View full answer

What is the technical trend for Perfectpac?

09-Jun-2025

As of June 2, 2025, Perfectpac's technical trend is sideways with mixed signals, showing mild bullishness on the weekly MACD and Bollinger Bands, but bearishness on the monthly MACD and daily moving averages, indicating a lack of clear direction.

As of 2 June 2025, the technical trend for Perfectpac has changed from mildly bearish to sideways. The current stance is neutral, reflecting mixed signals across various indicators. The weekly MACD is mildly bullish, while the monthly MACD is mildly bearish, indicating a divergence in momentum. The Bollinger Bands are bullish on both weekly and monthly time frames, suggesting potential upward movement. However, the daily moving averages are mildly bearish, which adds caution to the outlook. The KST and Dow Theory both show a mildly bullish stance on the weekly chart but are bearish on the monthly, further contributing to the sideways trend. Overall, the mixed signals indicate a lack of clear direction in the near term.

View full answer

When is the next results date for Perfectpac?

06-Jun-2025

No Upcoming Board Meetings

Has Perfectpac declared dividend?

06-Jun-2025

Perfectpac Ltd has declared a 50% dividend, amounting to 1 per share, with an ex-date of September 6, 2024. The dividend yield is 0.85%, and while short-term returns have fluctuated, long-term returns show significant growth.

Perfectpac Ltd has declared a 50% dividend.<BR><BR>Dividend Details:<BR>- Percentage announced: 50%<BR>- Amount per share: 1 per share<BR>- Ex-date: 06 Sep 24<BR><BR>Dividend Yield: 0.85%.<BR><BR>Total Returns by Period:<BR>In the last 6 months, the price return was -10.0%, the dividend return was 0%, resulting in a total return of -10.0%.<BR><BR>Over the past year, the price return was 3.38%, the dividend return was 0.86%, leading to a total return of 4.24%.<BR><BR>In the 2-year period, the price return was 30.43%, the dividend return was 2.31%, culminating in a total return of 32.74%.<BR><BR>For the 3-year period, the price return was 262.5%, the dividend return was 22.58%, resulting in a total return of 285.08%.<BR><BR>In the last 4 years, the price return was 362.7%, the dividend return was 25.79%, leading to a total return of 388.49%.<BR><BR>Over the past 5 years, the price return was 335.11%, the dividend return was 29.88%, resulting in a total return of 364.99%.<BR><BR>Overall, Perfectpac Ltd has declared a dividend while showing varying total returns across different periods, with significant growth in the long-term returns despite some short-term fluctuations. The declared dividend and its yield indicate a commitment to returning value to shareholders.

View full answer
iScoreScore
Click here to find our call on this stock
Strong Sell
Sell
Hold
Buy
Strong Buy

Dashboard

1

Weak Long Term Fundamental Strength with an average Return on Equity (ROE) of 8.08%

  • Poor long term growth as Net Sales has grown by an annual rate of 11.53% over the last 5 years
2

Flat results in Mar 26

3

Below par performance in long term as well as near term

stock-summaryMojo Parameters

Mojo Parameters

Loading Valuation Snapshot...

Stock DNA

stock-summary
Industry

Paper, Forest & Jute Products

stock-summary
Market cap

INR 51 Cr (Micro Cap)

stock-summary
P/E

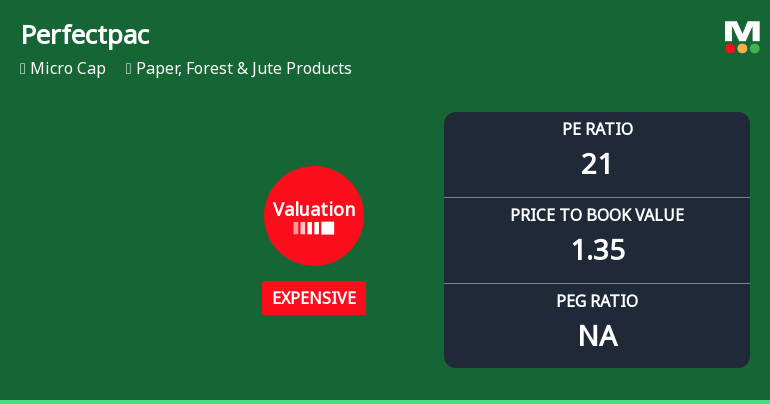
14.00

stock-summary
Industry P/E

21

stock-summary
Dividend Yield

1.41%

stock-summary
Debt Equity

0.07

stock-summary
Return on Equity

8.20%

stock-summary
Price to Book

1.19

Revenue and Profits:
Net Sales:
30 Cr
(Quarterly Results - Mar 2026)
Net Profit:
1 Cr
stock-summaryTotal Returns
Total Returns (Price + Dividend) stock-summary
Dividend Yield (1.41%)
TimePeriod
Price Return
Dividend Return
Total Return
3 Months
-13.76%
0%
-13.76%
6 Months
-22.12%
0%
-22.12%
1 Year
-33.04%
0.91%
-32.13%
2 Years
-41.0%
1.69%
-39.31%
3 Years
-17.88%
3.26%
-14.62%
4 Years
136.84%
7.83%
144.67%
5 Years
142.75%
13.16%
155.91%

Latest dividend: 1 per share ex-dividend date: Sep-04-2025

Risk Adjusted Returns v/s stock-summary
Returns Beta
Icon
Beta has not been calculated since enough price history is not available
stock-summaryNews & Corporate Actions

Announcements stock-summary

Compliances-Certificate under Reg. 74 (5) of SEBI (DP) Regulations 2018

03-Jul-2026 | Source : BSE

Please refer the enclosed certificate under Regulation 74(5) of the SEBI (Depositories and Participants) Regulations 2018 for the quarter ended June 30 2026.

Closure of Trading Window

24-Jun-2026 | Source : BSE

Intimation of closure of Trading Window for the purpose of announcement of Unaudited Financial Results for the quarter ending on June 30 2026.

Announcement under Regulation 30 (LODR)-Newspaper Publication

11-Jun-2026 | Source : BSE

Submission of copies of newspaper Advertisement informing the shareholders about the another special window that has been opened for re-lodgement of transfer deeds of physical securities.

Corporate Actions stock-summary

stock-summary
BOARD MEETING

No Upcoming Board Meetings

stock-summary
DIVIDEND

Perfectpac Ltd has declared 50% dividend, ex-date: 04 Sep 25

stock-summary
SPLITS

Perfectpac Ltd has announced 2:10 stock split, ex-date: 21 Oct 22

stock-summary
BONUS

No Bonus history available

stock-summary
RIGHTS

Perfectpac Ltd has announced 1:1 rights issue, ex-date: 11 Sep 09

stock-summaryKey Factors

Quality key factors stock-summary

Factor
Value
Sales Growth (5y)
11.53%
EBIT Growth (5y)
32.56%
EBIT to Interest (avg)
3.95
Debt to EBITDA (avg)
0.81
Net Debt to Equity (avg)
0.07
Sales to Capital Employed (avg)
2.65
Tax Ratio
25.18%
Dividend Payout Ratio
21.14%
Pledged Shares
0
Institutional Holding
0.06%
ROCE (avg)
10.45%
ROE (avg)
8.08%

Valuation key factors

Factor
Value
P/E Ratio
14
Industry P/E
21
Price to Book Value
1.19
EV to EBIT
11.29
EV to EBITDA
7.23
EV to Capital Employed
1.18
EV to Sales
0.44
PEG Ratio
4.15
Dividend Yield
1.41%
ROCE (Latest)
10.41%
ROE (Latest)
8.20%

Technicals key factors

Indicator
Weekly
Monthly
MACD
Bearish
Bearish
RSI
No Signal
No Signal
Bollinger Bands
Bearish
Mildly Bearish
Moving Averages
Bearish (Daily)
KST
Bearish
Bearish
Dow Theory
Mildly Bullish
No Trend
stock-summary Technical Indicator Scale: Bearish, Mildly Bearish, Sideways, Mildly Bullish, Bullish  Turned 
stock-summaryShareholding
Shareholding Snapshot : Jun 2026stock-summary
Shareholding Compare (%holding) stock-summary
Majority shareholders

Promoters

Pledged Promoter Holdings

None

Mutual Funds

Held by 0 Schemes

FIIs

Held by 0 FIIs

Promoter with highest holding

Sanjay Rajgarhia (51.63%)

Highest Public shareholder

Bhavana Govindbhai Desai (2%)

Individual Investors Holdings

23.9%

stock-summaryFinancial
[
  {
    "link": "quarterly",
    "btn_text": "All Quarterly Results",
    "header": "Quarterly Results Snapshot (Standalone) - Mar'26 - QoQ",
    "rhs": [
      {
        "prefix": "Net Sales ",
        "suffix": "QoQ Growth in quarter ended Mar 2026 is 18.36% vs -14.68% in Dec 2025",
        "dir": 1
      },
      {
        "prefix": "Standalone Net Profit ",
        "suffix": "QoQ Growth in quarter ended Mar 2026 is 2,025.00% vs -103.33% in Dec 2025",
        "dir": 1
      }
    ],
    "table": {
      "header": [
        "Mar'26",
        "Dec'25",
        "Change(%)"
      ],
      "body": [
        {
          "field": "Net Sales",
          "val1": "29.65",
          "val2": "25.05",
          "chgp": "18.36%",
          "chgp_class": "positive"
        },
        {
          "field": "Operating Profit (PBDIT) excl Other Income",
          "val1": "1.60",
          "val2": "0.90",
          "chgp": "77.78%",
          "chgp_class": "positive"
        },
        {
          "field": "Interest",
          "val1": "0.09",
          "val2": "0.06",
          "chgp": "50.00%",
          "chgp_class": "negative"
        },
        {
          "field": "Exceptional Items",
          "val1": "0.00",
          "val2": "-0.12",
          "chgp": "100.00%",
          "chgp_class": "positive"
        },
        {
          "field": "Standalone Net Profit",
          "val1": "0.77",
          "val2": "-0.04",
          "chgp": "2,025.00%",
          "chgp_class": "positive"
        },
        {
          "field": "Operating Profit Margin (Excl OI)",
          "val1": "5.40%",
          "val2": "3.59%",
          "chgp": "1.81%",
          "chgp_class": "positive"
        }
      ]
    }
  },
  {
    "link": "half-yearly",
    "btn_text": "All Half Yearly Results",
    "header": "Half Yearly Results Snapshot (Standalone) - Sep'25",
    "rhs": [
      {
        "prefix": "Net Sales ",
        "suffix": " Growth in half year ended Sep 2025 is 5.54% vs 13.45% in Sep 2024",
        "dir": -1
      },
      {
        "prefix": "Standalone Net Profit ",
        "suffix": " Growth in half year ended Sep 2025 is 34.64% vs -23.50% in Sep 2024",
        "dir": 1
      }
    ],
    "table": {
      "header": [
        "Sep'25",
        "Sep'24",
        "Change(%)"
      ],
      "body": [
        {
          "field": "Net Sales",
          "val1": "59.04",
          "val2": "55.94",
          "chgp": "5.54%",
          "chgp_class": "positive"
        },
        {
          "field": "Operating Profit (PBDIT) excl Other Income",
          "val1": "4.41",
          "val2": "3.43",
          "chgp": "28.57%",
          "chgp_class": "positive"
        },
        {
          "field": "Interest",
          "val1": "0.05",
          "val2": "0.05",
          "chgp": "",
          "chgp_class": "neutral"
        },
        {
          "field": "Exceptional Items",
          "val1": "0.00",
          "val2": "0.00",
          "chgp": "",
          "chgp_class": "neutral"
        },
        {
          "field": "Standalone Net Profit",
          "val1": "2.41",
          "val2": "1.79",
          "chgp": "34.64%",
          "chgp_class": "positive"
        },
        {
          "field": "Operating Profit Margin (Excl OI)",
          "val1": "7.47%",
          "val2": "6.13%",
          "chgp": "1.34%",
          "chgp_class": "positive"
        }
      ]
    }
  },
  {
    "link": "nine-monthly",
    "btn_text": "All Nine Monthly Results",
    "header": "Nine Monthly Results Snapshot (Standalone) - Dec'25",
    "rhs": [
      {
        "prefix": "Net Sales ",
        "suffix": "YoY Growth in nine months ended Dec 2025 is 2.74% vs 11.86% in Dec 2024",
        "dir": -1
      },
      {
        "prefix": "Standalone Net Profit ",
        "suffix": "YoY Growth in nine months ended Dec 2025 is -4.05% vs -12.72% in Dec 2024",
        "dir": 1
      }
    ],
    "table": {
      "header": [
        "Dec'25",
        "Dec'24",
        "Change(%)"
      ],
      "body": [
        {
          "field": "Net Sales",
          "val1": "84.09",
          "val2": "81.85",
          "chgp": "2.74%",
          "chgp_class": "positive"
        },
        {
          "field": "Operating Profit (PBDIT) excl Other Income",
          "val1": "5.31",
          "val2": "4.89",
          "chgp": "8.59%",
          "chgp_class": "positive"
        },
        {
          "field": "Interest",
          "val1": "0.11",
          "val2": "0.08",
          "chgp": "37.50%",
          "chgp_class": "negative"
        },
        {
          "field": "Exceptional Items",
          "val1": "-0.12",
          "val2": "0.00",
          "chgp": "",
          "chgp_class": "neutral"
        },
        {
          "field": "Standalone Net Profit",
          "val1": "2.37",
          "val2": "2.47",
          "chgp": "-4.05%",
          "chgp_class": "negative"
        },
        {
          "field": "Operating Profit Margin (Excl OI)",
          "val1": "6.31%",
          "val2": "5.97%",
          "chgp": "0.34%",
          "chgp_class": "positive"
        }
      ]
    }
  },
  {
    "link": "annual",
    "btn_text": "All Annual Results",
    "header": "Annual Results Snapshot (Standalone) - Mar'26",
    "rhs": [
      {
        "prefix": "Net Sales ",
        "suffix": "YoY Growth in year ended Mar 2026 is 0.24% vs 12.20% in Mar 2025",
        "dir": -1
      },
      {
        "prefix": "Standalone Net Profit ",
        "suffix": "YoY Growth in year ended Mar 2026 is 0.00% vs -20.85% in Mar 2025",
        "dir": 1
      }
    ],
    "table": {
      "header": [
        "Mar'26",
        "Mar'25",
        "Change(%)"
      ],
      "body": [
        {
          "field": "Net Sales",
          "val1": "113.73",
          "val2": "113.46",
          "chgp": "0.24%",
          "chgp_class": "positive"
        },
        {
          "field": "Operating Profit (PBDIT) excl Other Income",
          "val1": "6.89",
          "val2": "6.43",
          "chgp": "7.15%",
          "chgp_class": "positive"
        },
        {
          "field": "Interest",
          "val1": "0.21",
          "val2": "0.17",
          "chgp": "23.53%",
          "chgp_class": "negative"
        },
        {
          "field": "Exceptional Items",
          "val1": "-0.12",
          "val2": "0.00",
          "chgp": "",
          "chgp_class": "neutral"
        },
        {
          "field": "Standalone Net Profit",
          "val1": "3.15",
          "val2": "3.15",
          "chgp": "",
          "chgp_class": "neutral"
        },
        {
          "field": "Operating Profit Margin (Excl OI)",
          "val1": "6.06%",
          "val2": "5.67%",
          "chgp": "0.39%",
          "chgp_class": "positive"
        }
      ]
    }
  }
]

Quarterly Results Snapshot (Standalone) - Mar'26 - QoQstock-summary

Mar'26
Dec'25
Change(%)
Net Sales
29.65
25.05
18.36%
Operating Profit (PBDIT) excl Other Income
1.60
0.90
77.78%
Interest
0.09
0.06
50.00%
Exceptional Items
0.00
-0.12
100.00%
Standalone Net Profit
0.77
-0.04
2,025.00%
Operating Profit Margin (Excl OI)
5.40%
3.59%
1.81%
Values in Rs Cr.
Direction Arrows
Net Sales

QoQ Growth in quarter ended Mar 2026 is 18.36% vs -14.68% in Dec 2025

Direction Arrows
Standalone Net Profit

QoQ Growth in quarter ended Mar 2026 is 2,025.00% vs -103.33% in Dec 2025

Half Yearly Results Snapshot (Standalone) - Sep'25stock-summary

Sep'25
Sep'24
Change(%)
Net Sales
59.04
55.94
5.54%
Operating Profit (PBDIT) excl Other Income
4.41
3.43
28.57%
Interest
0.05
0.05
Exceptional Items
0.00
0.00
Standalone Net Profit
2.41
1.79
34.64%
Operating Profit Margin (Excl OI)
7.47%
6.13%
1.34%
Values in Rs Cr.
Direction Arrows
Net Sales

Growth in half year ended Sep 2025 is 5.54% vs 13.45% in Sep 2024

Direction Arrows
Standalone Net Profit

Growth in half year ended Sep 2025 is 34.64% vs -23.50% in Sep 2024

Nine Monthly Results Snapshot (Standalone) - Dec'25stock-summary

Dec'25
Dec'24
Change(%)
Net Sales
84.09
81.85
2.74%
Operating Profit (PBDIT) excl Other Income
5.31
4.89
8.59%
Interest
0.11
0.08
37.50%
Exceptional Items
-0.12
0.00
Standalone Net Profit
2.37
2.47
-4.05%
Operating Profit Margin (Excl OI)
6.31%
5.97%
0.34%
Values in Rs Cr.
Direction Arrows
Net Sales

YoY Growth in nine months ended Dec 2025 is 2.74% vs 11.86% in Dec 2024

Direction Arrows
Standalone Net Profit

YoY Growth in nine months ended Dec 2025 is -4.05% vs -12.72% in Dec 2024

Annual Results Snapshot (Standalone) - Mar'26stock-summary

Mar'26
Mar'25
Change(%)
Net Sales
113.73
113.46
0.24%
Operating Profit (PBDIT) excl Other Income
6.89
6.43
7.15%
Interest
0.21
0.17
23.53%
Exceptional Items
-0.12
0.00
Standalone Net Profit
3.15
3.15
Operating Profit Margin (Excl OI)
6.06%
5.67%
0.39%
Values in Rs Cr.
Direction Arrows
Net Sales

YoY Growth in year ended Mar 2026 is 0.24% vs 12.20% in Mar 2025

Direction Arrows
Standalone Net Profit

YoY Growth in year ended Mar 2026 is 0.00% vs -20.85% in Mar 2025

stock-summaryCompany CV
About Perfectpac Ltd stock-summary
stock-summary
Perfectpac Ltd
Micro Cap
Paper, Forest & Jute Products
Perfectpac Limited was incorporated in 1973. The Company was one of the pioneers in the manufacture of corrugated fiberboard containers and is today one of the largest units in Northern India. Located at Faridabad, the Unit has an installed capacity of 9000 MT per annum. It diversified into the manufacturer of Expanded Polystrene products in 1996. The Company set up a second unit in year 2000 at Greater Noida with a installed capacity of 9000 MT per annum.
Company Coordinates stock-summary
Company Details
910 Chiranjiv Tower, 43 Nehru Place New Delhi New Delhi : 110019
stock-summary
Tel: 91-11-26441015/16/17
stock-summary
amehta@perfectpac.com
Registrar Details
Skyline Financial Services Pvt Ltd , D-153/A, 1st Floor, Okhla Industrial Area, Phase - I, New Delhi