Grameva

  • Market Cap: Micro Cap
  • Industry: Paper, Forest & Jute Products
  • ISIN: INE578R01011
  • NSEID:
  • BSEID: 539120
INR
78.88
3.75 (4.99%)
BSENSE

May 29

BSE+NSE Vol: 1.19 k

  • Price Points
  • Score
  • Mojo Parameters
  • Total Return
  • News and Corporate Actions
  • Key factors
  • Shareholding
  • Financials
  • CompanyCV
stock-summaryPrice Point
High/Low

1Day

52 Week

Valuation
Technical
Day's Volume

CASH

1.19 k (20.91%) Volume

Shareholding (Mar 2026)

FII

0.00%

Held by 0 FIIs

DII

0.01%

Held by 0 DIIs

Promoter

33.25%

Who are in the management team of Bangalore Fort?

06-Jun-2025

As of March 2022, the management team of Bangalore Fort includes Mahendra Singh (Managing Director), Aman Jain, Naba Kumr Das, Umesh Sinha, and Moutushi Sengupta (all Independent Directors), along with Archana Singh (Company Secretary & Compliance Officer).

As of March 2022, the management team of Bangalore Fort includes the following individuals:<BR><BR>1. Mahendra Singh - Managing Director<BR>2. Aman Jain - Non-Executive & Independent Director<BR>3. Naba Kumr Das - Non-Executive & Independent Director<BR>4. Umesh Sinha - Independent Director<BR>5. Moutushi Sengupta - Independent Director<BR>6. Archana Singh - Company Secretary & Compliance Officer<BR><BR>These members play various roles in the governance and oversight of the company.

View full answer

Has Bangalore Fort declared dividend?

06-Jun-2025

No Dividend History Available

What is the technical trend for Bangalore Fort?

09-Jun-2025

As of June 6, 2025, the trend is neutral with a current price of 43.80, showing short-term strength from a previous close of 41.65, but insufficient data prevents a clear bullish or bearish stance.

As of 6 June 2025, the technical trend has changed from mildly bearish to does not qualify. Currently, there is insufficient data to determine a clear bullish or bearish stance. The recent price movement shows a current price of 43.80, up from a previous close of 41.65, indicating some short-term strength. However, without additional technical indicators or summary data, a definitive trend cannot be established.

View full answer

Who are the peers of the Bangalore Fort?

16-Jul-2025

Bangalore Fort's peers include Kay Power & Paper, Vapi Enterprise, Cella Space, and others, with Labelkraft Tech. showing excellent growth and Kay Power & Paper having the lowest 1-year return at -69.85%. Bangalore Fort's 1-year return is -37.84%, better than Kay Power & Paper but worse than Saffron Industri, which has the highest return at 151.20%.

Peers: The peers of Bangalore Fort are Kay Power &Paper, Vapi Enterprise, Cella Space, Sangal Papers, Labelkraft Tech., Sh. Karthik Pap., Saffron Industri, Natl. Plywood, Rama Paper Mills, and Konndor Indust.<BR><BR>Quality Snapshot: Excellent growth is observed at Labelkraft Tech., while Average management risk is found at Kay Power &Paper and Rama Paper Mills. Below Average management risk is noted at Vapi Enterprise, Sangal Papers, and Konndor Indust., while Cella Space, Sh. Karthik Pap., Saffron Industri, and Natl. Plywood do not qualify. Below Average growth is seen at Kay Power &Paper, Vapi Enterprise, Sangal Papers, and Bangalore Fort, while Cella Space, Sh. Karthik Pap., Saffron Industri, and Natl. Plywood do not qualify. Below Average capital structure is present at Kay Power &Paper, Vapi Enterprise, Sangal Papers, and Bangalore Fort, while Labelkraft Tech. shows Good capital structure.<BR><BR>Return Snapshot: The peer with the highest 1-year return is Saffron Industri at 151.20%, while the lowest is Kay Power &Paper at -69.85%. Bangalore Fort's 1-year return of -37.84% is better than Kay Power &Paper but worse than Saffron Industri. Additionally, the six-month return is negative for Kay Power &Paper, Vapi Enterprise, Sangal Papers, Labelkraft Tech., Bangalore Fort, Rama Paper Mills, and Natl. Plywood.

View full answer

What does Bangalore Fort do?

17-Jul-2025

Bangalore Fort Farms Ltd trades in jute and agro products and is categorized as a Micro Cap company in the Paper, Forest & Jute Products industry. As of March 2025, it reported net sales of 128 Cr and a net profit of 3 Cr.

Overview:<BR>Bangalore Fort Farms Ltd is engaged in the trading of jute and agro products, operating within the Micro Cap category in the Paper, Forest & Jute Products industry.<BR><BR>History:<BR>The company was incorporated on 24 October 1966. It has recently reported net sales and profit for the quarter ending March 2025.<BR><BR>Financial Snapshot:<BR>Net Sales: 128 Cr (Quarterly Results - Mar 2025) <BR>Net Profit: 3 Cr (Quarterly Results - Mar 2025) <BR>Market Cap: INR 19 Cr (Micro Cap)<BR><BR>Key Metrics:<BR>P/E: 18.00 <BR>Industry P/E: 32 <BR>Dividend Yield: 0.00% <BR>Debt-Equity: 0.35 <BR>Return on Equity: 6.23% <BR>Price to Book: 2.43<BR><BR>Contact Details:<BR>Address: 16A Brabourne Road, 6th Floor Kolkata West Bengal : 700001 <BR>Email: info@bangalorefortfarms.com <BR>Website: http://www.bangalorefortfarms.com

View full answer

Who are the top shareholders of the Bangalore Fort?

17-Jul-2025

The top shareholders of Bangalore Fort are Revati Holding Private Limited with 33.25%, Jagsakti Merchandise Private Limited at 16.56%, and individual investors holding 39.6%. There are no pledged promoter holdings, mutual funds, or foreign institutional investors involved.

The top shareholders of Bangalore Fort include Revati Holding Private Limited, which holds the largest share at 33.25%. Following that, Jagsakti Merchandise Private Limited is the highest public shareholder with a 16.56% stake. Additionally, individual investors collectively hold 39.6% of the company. There are no pledged promoter holdings, and currently, there are no mutual funds or foreign institutional investors involved.

View full answer

How big is Bangalore Fort?

24-Jul-2025

As of 24th July, Bangalore Fort Farms Ltd has a market capitalization of 17.00 Cr, with recent net sales of 41.40 Cr and a net profit of 0.48 Cr over the last four quarters. Shareholder's funds are 7.70 Cr, and total assets are valued at 16.71 Cr.

As of 24th July, <BR><BR>Market Cap: Bangalore Fort Farms Ltd has a market capitalization of 17.00 Cr and is classified as a Micro Cap.<BR><BR>Recent Quarterly Performance: The sum of Net Sales for the latest 4 quarters is 41.40 Cr, while the sum of Net Profit for the same period is 0.48 Cr.<BR><BR>Balance Sheet Snapshot: The reporting period for the latest annual data is March 2024. Shareholder's Funds stand at 7.70 Cr, and Total Assets are valued at 16.71 Cr.

View full answer

How has been the historical performance of Bangalore Fort?

13-Nov-2025

Bangalore Fort's financial performance has shown consistent growth, with net sales rising from 24.46 Cr in March 2023 to 41.41 Cr in March 2025, while profit before tax increased to 0.55 Cr and profit after tax to 0.49 Cr in the same period. Despite a decrease in operating profit, the company's earnings per share improved significantly, and cash flow from operations turned positive, indicating enhanced operational efficiency.

Answer:<BR>The historical performance of Bangalore Fort shows a steady increase in net sales and total operating income over the years, reaching 41.41 Cr in March 2025, up from 37.34 Cr in March 2024 and significantly higher than 24.46 Cr in March 2023. The total expenditure also rose to 40.50 Cr in March 2025, reflecting a consistent upward trend from 36.18 Cr in March 2024. Operating profit, excluding other income, was 0.91 Cr in March 2025, a decrease from 1.16 Cr in March 2024, but still an improvement from 0.22 Cr in March 2023. Profit before tax increased to 0.55 Cr in March 2025, compared to 0.48 Cr in March 2024, while profit after tax rose to 0.49 Cr from 0.34 Cr in the previous year. The earnings per share (EPS) also improved to 1.02 in March 2025 from 0.71 in March 2024. On the balance sheet, total liabilities increased to 16.71 Cr in March 2024 from 13.57 Cr in March 2023, with total assets also rising to 16.71 Cr. The cash flow from operating activities showed a positive trend with 1.00 Cr in March 2024, compared to 0.00 Cr in March 2023.<BR><BR>Breakdown:<BR>Bangalore Fort's financial performance has demonstrated a consistent growth trajectory in net sales, which increased from 24.46 Cr in March 2023 to 41.41 Cr in March 2025. This growth in revenue was accompanied by a rise in total operating income, which mirrored the sales trend. However, total expenditure also increased, leading to an operating profit of 0.91 Cr in March 2025, down from the previous year's 1.16 Cr. Despite this, profit before tax and profit after tax showed positive growth, indicating improved profitability, with figures of 0.55 Cr and 0.49 Cr respectively in March 2025. The company's EPS rose significantly, reflecting enhanced shareholder value. On the balance sheet, total liabilities and assets both increased, indicating a growing business scale, while cash flow from operating activities turned positive, suggesting improved operational efficiency.

View full answer

Is Bangalore Fort overvalued or undervalued?

24-Nov-2025

As of November 21, 2025, Bangalore Fort is considered overvalued with a PE ratio of 51.77, significantly higher than its peers, indicating that investors may be paying a premium for its future growth potential despite strong past performance.

As of 21 November 2025, Bangalore Fort's valuation grade has moved from fair to expensive, indicating a shift towards overvaluation. The company is currently assessed as overvalued, with a PE ratio of 51.77, a Price to Book Value of 3.55, and an EV to EBITDA ratio of 33.65. These ratios suggest that the stock is trading at a premium compared to its earnings and book value.<BR><BR>In comparison to its peers, Bangalore Fort's PE ratio of 51.77 is significantly higher than that of Sagility, which stands at 28.43, and even higher than the very attractive Altius Telecom at 52.52. This disparity highlights the overvaluation of Bangalore Fort relative to its industry peers. Additionally, while the company has shown strong returns over the past three years, outperforming the Sensex, the current valuation metrics suggest that investors may be paying too much for future growth potential.

View full answer

When is the next results date for Grameva Limited?

13-May-2026

The next results date for Grameva Limited is 20 May 2026.

The next results date for Grameva Limited is scheduled for 20 May 2026.

View full answer

Are Grameva Limited latest results good or bad?

21-May-2026

Grameva Limited's latest Q4 FY26 results are impressive, with net sales up 342.96% and net profit soaring 2,822%, marking record highs. However, concerns about volatile operating margins and low profitability metrics suggest caution regarding the sustainability of this performance.

Grameva Limited's latest results for Q4 FY26 show a significant turnaround, with net sales increasing by an impressive 342.96% quarter-on-quarter to ₹55.68 crores, and net profit soaring by 2,822% to ₹2.63 crores. This marks the highest quarterly revenue and profit in the company's history, suggesting a strong performance in this period.<BR><BR>However, despite these headline figures, there are underlying concerns. The company's operating margins have been highly volatile, swinging from negative to a positive 7.45%, and profitability metrics like return on equity (ROE) and return on capital employed (ROCE) remain low, averaging just 2.95% and 3.60%, respectively. This raises questions about the sustainability of the recent performance and the overall health of the business.<BR><BR>While the latest results are certainly impressive in isolation, the extreme volatility in earnings and the structural challenges facing the company indicate that the results may not be indicative of a stable or predictable future. Therefore, while the latest quarter's performance can be seen as good, the broader context suggests caution regarding the company's long-term prospects.

View full answer

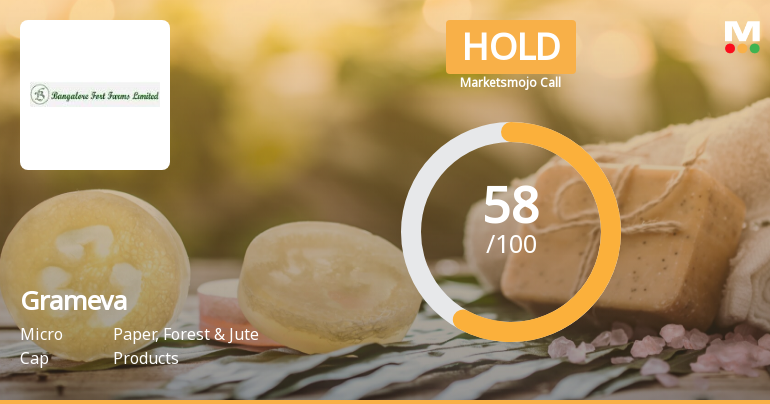
Should I buy, sell or hold Grameva Limited?

28-May-2026

Why is Grameva Limited falling/rising?

30-May-2026

As of 29-May, Grameva Limited's stock price is rising to Rs. 78.88, reflecting a 4.99% increase. This rise is driven by strong recent performance, significant gains compared to the Sensex, and achieving a new 52-week high, despite a decline in investor participation.

As of 29-May, Grameva Limited's stock price is rising, currently at Rs. 78.88, reflecting a change of 3.75 (4.99%) upward. This increase can be attributed to several key factors. Firstly, the stock has been on a positive trajectory, gaining for the last eight consecutive days and achieving a remarkable 47.66% return during this period. Additionally, today the stock opened with a gain of 4.99% and reached a new 52-week high of Rs. 78.88.<BR><BR>In terms of performance relative to the market, Grameva Limited has significantly outperformed the Sensex, with a 21.50% increase over the past week compared to a decline of 0.85% in the benchmark index. Over the past month, the stock has risen by 41.49%, while the Sensex has fallen by 3.51%. Year-to-date, Grameva's stock has increased by 49.54%, contrasting sharply with the Sensex's decline of 12.26%. The long-term performance is also impressive, with a 408.90% increase over three years and a staggering 490.42% rise over five years.<BR><BR>Moreover, Grameva Limited is trading above its moving averages across various time frames, indicating strong upward momentum. However, it is worth noting that there has been a decline in investor participation, with delivery volume dropping by 85.13% against the five-day average. Despite this, the stock remains liquid enough for trading.<BR><BR>Overall, the combination of strong recent performance, significant gains compared to the benchmark, and the achievement of a new high contributes to the rising stock price of Grameva Limited.

View full answer
iScoreScore
Click here to find our call on this stock
Strong Sell
Sell
Hold
Buy
Strong Buy

Dashboard

1

With a growth in Net Profit of 2822.22%, the company declared Outstanding results in Mar 26

  • ROCE(HY) Highest at 23.03%
  • NET SALES(Q) Highest at Rs 55.68 cr
  • PBDIT(Q) Highest at Rs 4.15 cr.
2

With ROCE of 21.5, it has a Very Attractive valuation with a 2.4 Enterprise value to Capital Employed

3

Majority shareholders : Non Institution

 
4

Market Beating performance in long term as well as near term

stock-summaryMojo Parameters

Mojo Parameters

Loading Valuation Snapshot...

Stock DNA

stock-summary
Industry

Paper, Forest & Jute Products

stock-summary
Market cap

INR 38 Cr (Micro Cap)

stock-summary
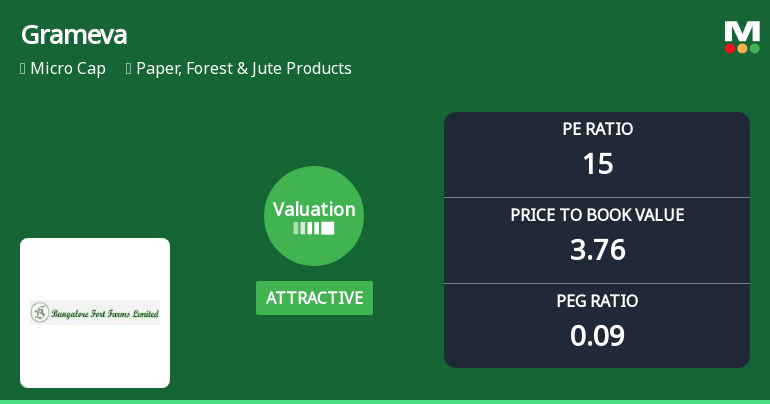
P/E

13.00

stock-summary
Industry P/E

32

stock-summary
Dividend Yield

0.00%

stock-summary
Debt Equity

0.73

stock-summary
Return on Equity

25.04%

stock-summary
Price to Book

3.21

Revenue and Profits:
Net Sales:
56 Cr
(Quarterly Results - Mar 2026)
Net Profit:
3 Cr
stock-summaryTotal Returns
Total Returns (Price + Dividend) stock-summary
Dividend Yield (0%)
TimePeriod
Price Return
Dividend Return
Total Return
3 Months
25.21%
0%
25.21%
6 Months
28.74%
0%
28.74%
1 Year
89.07%
0%
89.07%
2 Years
89.66%
0%
89.66%
3 Years
408.9%
0%
408.9%
4 Years
232.13%
0%
232.13%
5 Years
490.42%
0%
490.42%

Grameva for the last several years.

Risk Adjusted Returns v/s stock-summary
Returns Beta
Icon
Beta has not been calculated since enough price history is not available
stock-summaryNews & Corporate Actions

News

Announcements stock-summary

Non-Applicability Of Regulation 24A Of SEBI (Listing Obligation And Disclosure Requirement) Regulation 2015

26-May-2026 | Source : BSE

In reference to the above captioned subject this is to inform you that Regulation 24Aof SEBI (LODR) Regulations 2015 is not applicable to the Company as our Company is exempted under Regulation 15(2) of the SEBI (LODR) Regulations 2015 i.e Corporate Governance as the net worth and paid up capital of the company does not exceed the prescribed limit as per SEBI (LODR) Regulations 2015 thereof we are exempt from submitting the Annual Secretarial Compliance Report.

Announcement under Regulation 30 (LODR)-Resignation of Statutory Auditors

25-May-2026 | Source : BSE

Pursuant to Regulation 30 of the SEBI (LODR) Regulations 2015 read with Schedule III therto we wish to inform you that M/s. Amit Ray & Co. Chartered Accountants (FRN: 000483C) have tendered their resignation as the Statutory Auditors of the Co. vide resignation letter dated 25.05.2026 w.e.f 25.05.2026. The resignation auditor has confirmed that there are no concerns or issues raised about the management of the Co. and there is no disagreement with the management on any matter relating to the financial statements or audit process. The resignation has been tendered due to professional and resource constraints as mentioned in the resignation letter enclosed herewith. The Audit Committee shall take note of the resignation in accordance with the applicable regulatory requirements. The Board of Directors of the Co. shall consider the appointment of a new Statutory Auditor to fll the casual vacancy caused due to the aforesaid resignation in due course subject to applicable approvals.

Announcement under Regulation 30 (LODR)-Newspaper Publication

21-May-2026 | Source : BSE

We are enclosing herewith the copies of the newspaper advertisement relating to the publication of the Extract of Audited Financial Results of the Company for the quarter and financial year ended on 31st March 2026 as published in Business Standard (English Language) & Arthik Lipi (Bengali Language) on 21st May 2026 in compliance with the provisions of Regulation 47 of the Securities and Exchange Board of India (Listing Obligations and Disclosure Requirements) Regulations 2015

Corporate Actions stock-summary

stock-summary
BOARD MEETING

No Upcoming Board Meetings

stock-summary
DIVIDEND

No Dividend history available

stock-summary
SPLITS

No Splits history available

stock-summary
BONUS

No Bonus history available

stock-summary
RIGHTS

No Rights history available

stock-summaryKey Factors

Quality key factors stock-summary

Factor
Value
Sales Growth (5y)
32.56%
EBIT Growth (5y)
38.25%
EBIT to Interest (avg)
1.24
Debt to EBITDA (avg)
4.64
Net Debt to Equity (avg)
0.73
Sales to Capital Employed (avg)
2.58
Tax Ratio
32.28%
Dividend Payout Ratio
0
Pledged Shares
0
Institutional Holding
0.01%
ROCE (avg)
5.58%
ROE (avg)
7.50%

Valuation key factors

Factor
Value
P/E Ratio
13
Industry P/E
32
Price to Book Value
3.37
EV to EBIT
11.02
EV to EBITDA
10.02
EV to Capital Employed
2.37
EV to Sales
0.56
PEG Ratio
NA
Dividend Yield
NA
ROCE (Latest)
21.50%
ROE (Latest)
25.04%

Technicals key factors

Indicator
Weekly
Monthly
MACD
Bullish
Bullish
RSI
Bearish
No Signal
Bollinger Bands
Bullish
Bullish
Moving Averages
Bullish (Daily)
KST
Bullish
Mildly Bearish
Dow Theory
Mildly Bullish
Mildly Bullish
OBV
Mildly Bullish
No Trend
stock-summary Technical Indicator Scale: Bearish, Mildly Bearish, Sideways, Mildly Bullish, Bullish  Turned 
stock-summaryShareholding
Shareholding Snapshot : Mar 2026stock-summary
Shareholding Compare (%holding) stock-summary
Majority shareholders

Non Institution

Pledged Promoter Holdings

None

Mutual Funds

Held by 0 Schemes

FIIs

Held by 0 FIIs

Promoter with highest holding

Genesis Trade Links Pvt Ltd (33.25%)

Highest Public shareholder

Jagsakti Merchandise Private Limited (11.25%)

Individual Investors Holdings

39.61%

stock-summaryFinancial
[
  {
    "link": "quarterly",
    "btn_text": "All Quarterly Results",
    "header": "Quarterly Results Snapshot (Standalone) - Mar'26 - QoQ",
    "rhs": [
      {
        "prefix": "Net Sales ",
        "suffix": "QoQ Growth in quarter ended Mar 2026 is 342.96% vs 71.96% in Dec 2025",
        "dir": 1
      },
      {
        "prefix": "Standalone Net Profit ",
        "suffix": "QoQ Growth in quarter ended Mar 2026 is 2,822.22% vs 115.79% in Dec 2025",
        "dir": 1
      }
    ],
    "table": {
      "header": [
        "Mar'26",
        "Dec'25",
        "Change(%)"
      ],
      "body": [
        {
          "field": "Net Sales",
          "val1": "55.68",
          "val2": "12.57",
          "chgp": "342.96%",
          "chgp_class": "positive"
        },
        {
          "field": "Operating Profit (PBDIT) excl Other Income",
          "val1": "4.15",
          "val2": "0.05",
          "chgp": "8,200.00%",
          "chgp_class": "positive"
        },
        {
          "field": "Interest",
          "val1": "0.26",
          "val2": "0.08",
          "chgp": "225.00%",
          "chgp_class": "negative"
        },
        {
          "field": "Exceptional Items",
          "val1": "0.00",
          "val2": "0.00",
          "chgp": "",
          "chgp_class": "neutral"
        },
        {
          "field": "Standalone Net Profit",
          "val1": "2.63",
          "val2": "0.09",
          "chgp": "2,822.22%",
          "chgp_class": "positive"
        },
        {
          "field": "Operating Profit Margin (Excl OI)",
          "val1": "7.45%",
          "val2": "0.40%",
          "chgp": "7.05%",
          "chgp_class": "positive"
        }
      ]
    }
  },
  {
    "link": "half-yearly",
    "btn_text": "All Half Yearly Results",
    "header": "Half Yearly Results Snapshot (Standalone) - Sep'25",
    "rhs": [
      {
        "prefix": "Net Sales ",
        "suffix": " Growth in half year ended Sep 2025 is -37.65% vs 132.30% in Sep 2024",
        "dir": -1
      },
      {
        "prefix": "Standalone Net Profit ",
        "suffix": " Growth in half year ended Sep 2025 is 100.00% vs -80.65% in Sep 2024",
        "dir": 1
      }
    ],
    "table": {
      "header": [
        "Sep'25",
        "Sep'24",
        "Change(%)"
      ],
      "body": [
        {
          "field": "Net Sales",
          "val1": "14.44",
          "val2": "23.16",
          "chgp": "-37.65%",
          "chgp_class": "negative"
        },
        {
          "field": "Operating Profit (PBDIT) excl Other Income",
          "val1": "0.41",
          "val2": "0.16",
          "chgp": "156.25%",
          "chgp_class": "positive"
        },
        {
          "field": "Interest",
          "val1": "0.41",
          "val2": "0.26",
          "chgp": "57.69%",
          "chgp_class": "negative"
        },
        {
          "field": "Exceptional Items",
          "val1": "0.00",
          "val2": "0.00",
          "chgp": "",
          "chgp_class": "neutral"
        },
        {
          "field": "Standalone Net Profit",
          "val1": "0.12",
          "val2": "0.06",
          "chgp": "100.00%",
          "chgp_class": "positive"
        },
        {
          "field": "Operating Profit Margin (Excl OI)",
          "val1": "2.84%",
          "val2": "0.69%",
          "chgp": "2.15%",
          "chgp_class": "positive"
        }
      ]
    }
  },
  {
    "link": "nine-monthly",
    "btn_text": "All Nine Monthly Results",
    "header": "Nine Monthly Results Snapshot (Standalone) - Dec'25",
    "rhs": [
      {
        "prefix": "Net Sales ",
        "suffix": "YoY Growth in nine months ended Dec 2025 is -5.76% vs 48.19% in Dec 2024",
        "dir": -1
      },
      {
        "prefix": "Standalone Net Profit ",
        "suffix": "YoY Growth in nine months ended Dec 2025 is -4.55% vs -31.25% in Dec 2024",
        "dir": 1
      }
    ],
    "table": {
      "header": [
        "Dec'25",
        "Dec'24",
        "Change(%)"
      ],
      "body": [
        {
          "field": "Net Sales",
          "val1": "27.01",
          "val2": "28.66",
          "chgp": "-5.76%",
          "chgp_class": "negative"
        },
        {
          "field": "Operating Profit (PBDIT) excl Other Income",
          "val1": "0.46",
          "val2": "0.51",
          "chgp": "-9.80%",
          "chgp_class": "negative"
        },
        {
          "field": "Interest",
          "val1": "0.49",
          "val2": "0.44",
          "chgp": "11.36%",
          "chgp_class": "negative"
        },
        {
          "field": "Exceptional Items",
          "val1": "0.00",
          "val2": "0.00",
          "chgp": "",
          "chgp_class": "neutral"
        },
        {
          "field": "Standalone Net Profit",
          "val1": "0.21",
          "val2": "0.22",
          "chgp": "-4.55%",
          "chgp_class": "negative"
        },
        {
          "field": "Operating Profit Margin (Excl OI)",
          "val1": "1.70%",
          "val2": "1.78%",
          "chgp": "-0.08%",
          "chgp_class": "negative"
        }
      ]
    }
  },
  {
    "link": "annual",
    "btn_text": "All Annual Results",
    "header": "Annual Results Snapshot (Standalone) - Mar'26",
    "rhs": [
      {
        "prefix": "Net Sales ",
        "suffix": "YoY Growth in year ended Mar 2026 is 99.66% vs 10.90% in Mar 2025",
        "dir": 1
      },
      {
        "prefix": "Standalone Net Profit ",
        "suffix": "YoY Growth in year ended Mar 2026 is 516.33% vs 44.12% in Mar 2025",
        "dir": 1
      }
    ],
    "table": {
      "header": [
        "Mar'26",
        "Mar'25",
        "Change(%)"
      ],
      "body": [
        {
          "field": "Net Sales",
          "val1": "82.68",
          "val2": "41.41",
          "chgp": "99.66%",
          "chgp_class": "positive"
        },
        {
          "field": "Operating Profit (PBDIT) excl Other Income",
          "val1": "4.60",
          "val2": "0.91",
          "chgp": "405.49%",
          "chgp_class": "positive"
        },
        {
          "field": "Interest",
          "val1": "0.76",
          "val2": "0.74",
          "chgp": "2.70%",
          "chgp_class": "negative"
        },
        {
          "field": "Exceptional Items",
          "val1": "0.00",
          "val2": "0.00",
          "chgp": "",
          "chgp_class": "neutral"
        },
        {
          "field": "Standalone Net Profit",
          "val1": "3.02",
          "val2": "0.49",
          "chgp": "516.33%",
          "chgp_class": "positive"
        },
        {
          "field": "Operating Profit Margin (Excl OI)",
          "val1": "5.56%",
          "val2": "2.20%",
          "chgp": "3.36%",
          "chgp_class": "positive"
        }
      ]
    }
  }
]

Quarterly Results Snapshot (Standalone) - Mar'26 - QoQstock-summary

Mar'26
Dec'25
Change(%)
Net Sales
55.68
12.57
342.96%
Operating Profit (PBDIT) excl Other Income
4.15
0.05
8,200.00%
Interest
0.26
0.08
225.00%
Exceptional Items
0.00
0.00
Standalone Net Profit
2.63
0.09
2,822.22%
Operating Profit Margin (Excl OI)
7.45%
0.40%
7.05%
Values in Rs Cr.
Direction Arrows
Net Sales

QoQ Growth in quarter ended Mar 2026 is 342.96% vs 71.96% in Dec 2025

Direction Arrows
Standalone Net Profit

QoQ Growth in quarter ended Mar 2026 is 2,822.22% vs 115.79% in Dec 2025

Half Yearly Results Snapshot (Standalone) - Sep'25stock-summary

Sep'25
Sep'24
Change(%)
Net Sales
14.44
23.16
-37.65%
Operating Profit (PBDIT) excl Other Income
0.41
0.16
156.25%
Interest
0.41
0.26
57.69%
Exceptional Items
0.00
0.00
Standalone Net Profit
0.12
0.06
100.00%
Operating Profit Margin (Excl OI)
2.84%
0.69%
2.15%
Values in Rs Cr.
Direction Arrows
Net Sales

Growth in half year ended Sep 2025 is -37.65% vs 132.30% in Sep 2024

Direction Arrows
Standalone Net Profit

Growth in half year ended Sep 2025 is 100.00% vs -80.65% in Sep 2024

Nine Monthly Results Snapshot (Standalone) - Dec'25stock-summary

Dec'25
Dec'24
Change(%)
Net Sales
27.01
28.66
-5.76%
Operating Profit (PBDIT) excl Other Income
0.46
0.51
-9.80%
Interest
0.49
0.44
11.36%
Exceptional Items
0.00
0.00
Standalone Net Profit
0.21
0.22
-4.55%
Operating Profit Margin (Excl OI)
1.70%
1.78%
-0.08%
Values in Rs Cr.
Direction Arrows
Net Sales

YoY Growth in nine months ended Dec 2025 is -5.76% vs 48.19% in Dec 2024

Direction Arrows
Standalone Net Profit

YoY Growth in nine months ended Dec 2025 is -4.55% vs -31.25% in Dec 2024

Annual Results Snapshot (Standalone) - Mar'26stock-summary

Mar'26
Mar'25
Change(%)
Net Sales
82.68
41.41
99.66%
Operating Profit (PBDIT) excl Other Income
4.60
0.91
405.49%
Interest
0.76
0.74
2.70%
Exceptional Items
0.00
0.00
Standalone Net Profit
3.02
0.49
516.33%
Operating Profit Margin (Excl OI)
5.56%
2.20%
3.36%
Values in Rs Cr.
Direction Arrows
Net Sales

YoY Growth in year ended Mar 2026 is 99.66% vs 10.90% in Mar 2025

Direction Arrows
Standalone Net Profit

YoY Growth in year ended Mar 2026 is 516.33% vs 44.12% in Mar 2025

stock-summaryCompany CV
About Grameva Limited stock-summary
stock-summary
Grameva Limited
Micro Cap
Paper, Forest & Jute Products
Grameva Limited was initially incorporated as Bangalore Fort Farms Limited on 24 October, 1966. With due approval from the Registrar of Companies, Ministry of Corporate Affairs, the name of the Company is changed to Grameva Limited in 2025. The Company is principally engaged into Jute and Agro trading products in India. It has entered into exports of Jute bags and accessories after setting up a unit in Falta SEZ.
Company Coordinates stock-summary
Company Details
16A Brabourne Road, 6th Floor Kolkata West Bengal : 700001
stock-summary
Tel:
stock-summary
info@bangalorefortfarms.com
Registrar Details
Cameo Corporate Services Ltd , Subramanian Buildings No 1 , Club House Road, Chennai