
Compare Hubtown with Similar Stocks
Dashboard
Weak Long Term Fundamental Strength with an average Return on Capital Employed (ROCE) of 2.29%
- Company's ability to service its debt is weak with a poor EBIT to Interest (avg) ratio of 0.09
Flat results in Mar 26
With ROCE of 4.3, it has a Very Expensive valuation with a 1.1 Enterprise value to Capital Employed
Reducing Promoter Confidence
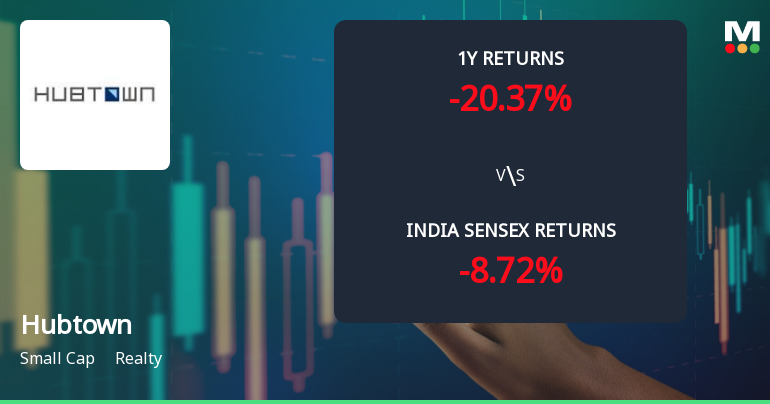
Underperformed the market in the last 1 year
Total Returns (Price + Dividend) 
Latest dividend: 1 per share ex-dividend date: Sep-17-2014
Risk Adjusted Returns v/s
Returns Beta

News
Hubtown Ltd Technical Momentum Shifts Amid Mixed Market Signals
Hubtown Ltd, a small-cap player in the realty sector, has experienced a notable shift in its technical momentum, reflecting a complex interplay of bullish and bearish signals across multiple timeframes. Despite a recent downgrade to a Strong Sell rating by MarketsMOJO, the stock’s price action and technical indicators reveal a nuanced picture that investors should carefully analyse.
Read full news article
Hubtown Ltd is Rated Strong Sell
Hubtown Ltd is rated Strong Sell by MarketsMOJO. This rating was last updated on 13 February 2026, reflecting a change from the previous 'Sell' grade. However, the analysis and financial metrics discussed here represent the stock's current position as of 29 June 2026, providing investors with an up-to-date view of the company’s fundamentals, valuation, financial trends, and technical outlook.
Read full news article
Hubtown Ltd Technical Momentum Shifts Amid Mixed Market Signals
Hubtown Ltd, a small-cap player in the Realty sector, has experienced a notable shift in its technical momentum, reflecting a complex interplay of bullish and bearish signals across multiple timeframes. Despite a recent downgrade to a Strong Sell rating by MarketsMOJO, the stock’s technical indicators reveal a nuanced picture that investors should carefully analyse amid ongoing market volatility.
Read full news article Announcements
Disclosures under Reg. 29(2) of SEBI (SAST) Regulations 2011
29-Jun-2026 | Source : BSEThe Exchange has received the disclosure under Regulation 29(2) of SEBI (Substantial Acquisition of Shares & Takeovers) Regulations 2011 for Vyomesh M Shah HUF
Disclosures under Reg. 31(1) and 31(2) of SEBI (SAST) Regulations 2011.
27-Jun-2026 | Source : BSEThe Exchange has received Disclosure under Regulation 31(1) and 31(2) of SEBI (Substantial Acquisition of Shares & Takeovers) Regulations 2011 on June 26 2026 for Vyomesh M Shah (HUF)
Announcement under Regulation 30 (LODR)-Press Release / Media Release
23-Jun-2026 | Source : BSEPress Release related to the scheme of arrangement involving merger of Saicharan Consultancy Private limited and 25 West Realty Private Limited with Hubtown Limited.
Corporate Actions

No Upcoming Board Meetings

Hubtown Ltd has declared 10% dividend, ex-date: 17 Sep 14

No Splits history available

No Bonus history available

No Rights history available
Quality key factors
Valuation key factors
Technicals key factors
 Technical Indicator Scale: Bearish, Mildly Bearish, Sideways, Mildly Bullish, Bullish Turned
 Shareholding Snapshot : Mar 2026
Shareholding Compare (%holding)
Non Institution
16.074
Held by 0 Schemes
Held by 36 FIIs (1.4%)
Rushank Vyomesh Shah (4.05%)
Anand Rathi Global Finance Limited (2.62%)
32.5%
Quarterly Results Snapshot (Consolidated) - Mar'26 - QoQ

QoQ Growth in quarter ended Mar 2026 is 82.67% vs -57.99% in Dec 2025
QoQ Growth in quarter ended Mar 2026 is 2.10% vs -7.15% in Dec 2025
Half Yearly Results Snapshot (Consolidated) - Sep'25

Growth in half year ended Sep 2025 is 80.57% vs 81.48% in Sep 2024
Growth in half year ended Sep 2025 is 367.18% vs 1,892.79% in Sep 2024
Nine Monthly Results Snapshot (Consolidated) - Dec'25
YoY Growth in nine months ended Dec 2025 is 55.11% vs 105.17% in Dec 2024
YoY Growth in nine months ended Dec 2025 is 192.21% vs 1,235.71% in Dec 2024
Annual Results Snapshot (Consolidated) - Mar'26
YoY Growth in year ended Mar 2026 is 57.54% vs 58.49% in Mar 2025
YoY Growth in year ended Mar 2026 is 219.06% vs 154.51% in Mar 2025
About Hubtown Ltd

Company Coordinates


