
Compare Valor Estate with Similar Stocks
Dashboard
With a Operating Losses, the company has a Weak Long Term Fundamental Strength
- Low ability to service debt as the company has a high Debt to EBITDA ratio of 10.72 times
- NET SALES(Q) At Rs 86.91 cr has Fallen at -83.0% (vs previous 4Q average)
- PBT LESS OI(Q) At Rs -109.36 cr has Fallen at -1774.2% (vs previous 4Q average)
- PAT(Q) At Rs -104.04 cr has Fallen at -872.2% (vs previous 4Q average)
With ROCE of 1.3, it has a Expensive valuation with a 1.4 Enterprise value to Capital Employed
44.72% of Promoter Shares are Pledged
Underperformed the market in the last 1 year
Stock DNA
Realty
INR 5,966 Cr (Small Cap)
NA (Loss Making)
35
0.00%
0.16
-0.69%
1.47
Total Returns (Price + Dividend) 
Valor Estate for the last several years.
Risk Adjusted Returns v/s
Returns Beta

News

Valor Estate Ltd is Rated Strong Sell
Valor Estate Ltd is rated Strong Sell by MarketsMOJO. This rating was last updated on 30 May 2026. However, the analysis and financial metrics discussed below reflect the stock’s current position as of 30 June 2026, providing investors with the most up-to-date view of the company’s fundamentals, returns, and market performance.
Read full news article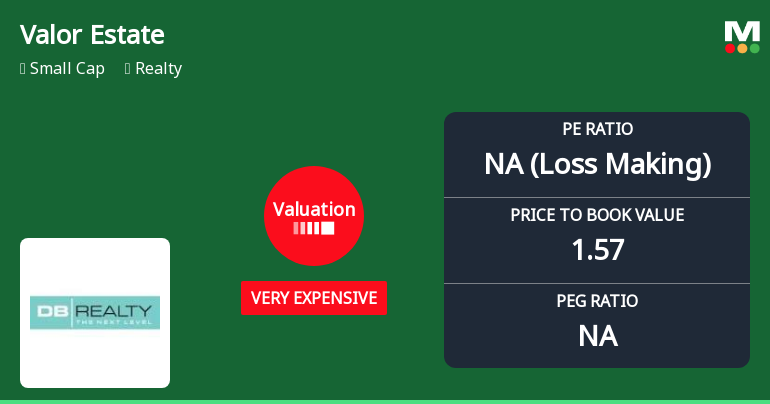
Valor Estate Ltd Valuation Shifts to Very Expensive Amid Mixed Market Returns
Valor Estate Ltd, a small-cap player in the Realty sector, has seen its valuation parameters shift markedly, with its price-to-earnings (P/E) ratio plunging to a deeply negative figure and price-to-book value (P/BV) rising, signalling a move from expensive to very expensive territory. Despite a modest day change of 0.08%, the stock’s valuation and performance metrics warrant close scrutiny for investors navigating the current real estate market landscape.
Read full news article
Valor Estate Ltd is Rated Strong Sell
Valor Estate Ltd is rated Strong Sell by MarketsMOJO, with this rating last updated on 30 May 2026. However, the analysis and financial metrics discussed here reflect the stock’s current position as of 19 June 2026, providing investors with the latest insights into the company’s performance and outlook.
Read full news article Announcements
Announcement under Regulation 30 (LODR)-Newspaper Publication
10-Jun-2026 | Source : BSEIntimation of Newspaper Advertisement of Notice of Postal Ballot and E-voting Information
Shareholder Meeting / Postal Ballot-Notice of Postal Ballot
09-Jun-2026 | Source : BSENotice of Postal Ballot - Disclosure under Regulation 30 of the SEBI (LODR) Regulations 2015
Announcement under Regulation 30 (LODR)-Newspaper Publication
31-May-2026 | Source : BSENewspapers Publication of Financial Results of the fourth quarter and year ended 31.03.2026
Corporate Actions

No Upcoming Board Meetings

No Dividend history available

No Splits history available

No Bonus history available

No Rights history available
Quality key factors
Valuation key factors
Technicals key factors
 Technical Indicator Scale: Bearish, Mildly Bearish, Sideways, Mildly Bullish, Bullish Turned
 Shareholding Snapshot : Mar 2026
Shareholding Compare (%holding)
Non Institution
44.7156
Held by 8 Schemes (0.14%)
Held by 103 FIIs (5.07%)
Aseela Goenka Sunita Goenka Alok Agarwal Trustee Of Goenka Family Trust (13.04%)
Razack Family Trust (6.31%)
26.5%
Quarterly Results Snapshot (Consolidated) - Mar'26 - QoQ

QoQ Growth in quarter ended Mar 2026 is -83.58% vs 286.69% in Dec 2025
QoQ Growth in quarter ended Mar 2026 is -195.30% vs 518.61% in Dec 2025
Half Yearly Results Snapshot (Consolidated) - Sep'25

Growth in half year ended Sep 2025 is 9,414.90% vs -85.42% in Sep 2024
Growth in half year ended Sep 2025 is 117.65% vs -114.83% in Sep 2024
Nine Monthly Results Snapshot (Consolidated) - Dec'25
YoY Growth in nine months ended Dec 2025 is 343.35% vs 59.33% in Dec 2024
YoY Growth in nine months ended Dec 2025 is 168.76% vs -109.29% in Dec 2024
Annual Results Snapshot (Consolidated) - Mar'26
YoY Growth in year ended Mar 2026 is 107.84% vs 114.45% in Mar 2025
YoY Growth in year ended Mar 2026 is 120.29% vs -109.52% in Mar 2025
About Valor Estate Ltd

Company Coordinates


