
Compare Bengal & Assam with Similar Stocks
Dashboard
Poor long term growth as Net Sales has grown by an annual rate of -26.42% and Operating profit at -16.96%
Flat results in Mar 26
With ROE of 7.8, it has a Expensive valuation with a 0.7 Price to Book Value
Despite the size of the company, domestic mutual funds hold only 0.01% of the company
Underperformed the market in the last 1 year
Stock DNA
Non Banking Financial Company (NBFC)
INR 7,526 Cr (Small Cap)
9.00
21
0.78%
0.06
7.78%
0.68
Total Returns (Price + Dividend) 
Latest dividend: 50.43594770874648 per share ex-dividend date: Sep-22-2025
Risk Adjusted Returns v/s
Returns Beta

News

Bengal & Assam Company Ltd is Rated Sell
Bengal & Assam Company Ltd is rated 'Sell' by MarketsMOJO, with this rating last updated on 20 October 2025. However, the analysis and financial metrics discussed here reflect the stock's current position as of 24 June 2026, providing investors with an up-to-date perspective on its performance and outlook.
Read full news article
Bengal & Assam Company Ltd is Rated Sell
Bengal & Assam Company Ltd is rated 'Sell' by MarketsMOJO, with this rating last updated on 20 October 2025. However, the analysis and financial metrics discussed here reflect the stock's current position as of 13 June 2026, providing investors with an up-to-date view of the company’s performance and outlook.
Read full news article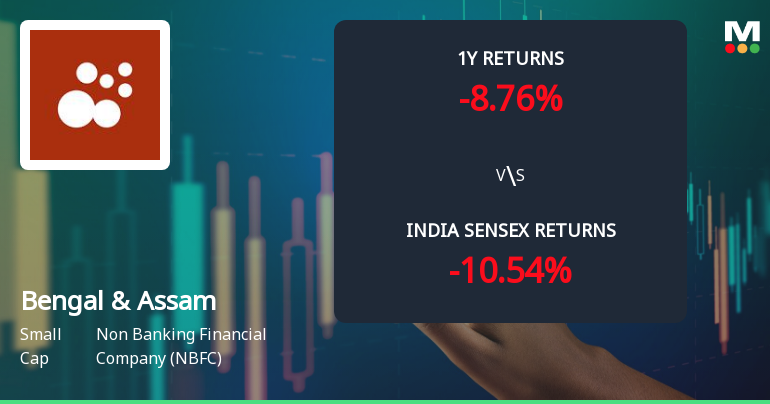
Bengal & Assam Company Ltd Faces Mildly Bearish Momentum Amid Technical Shifts
Bengal & Assam Company Ltd, a small-cap player in the Non Banking Financial Company (NBFC) sector, has experienced a notable shift in its technical momentum, moving from a sideways trend to a mildly bearish stance. Despite some bullish signals on weekly charts, monthly indicators suggest caution, reflecting a complex interplay of market forces impacting the stock’s near-term outlook.
Read full news article Announcements
Disclosures under Reg. 29(2) of SEBI (SAST) Regulations 2011
19-Jun-2026 | Source : BSEThe Exchange has received the disclosure under Regulation 29(2) of SEBI (Substantial Acquisition of Shares & Takeovers) Regulations 2011 for Vinita Singhania & Others
Announcement under Regulation 30 (LODR)-Newspaper Publication
19-Jun-2026 | Source : BSESecond Newspaper Publication regarding Opening of Special Window for transfer of Physical Shares
Disclosures under Reg. 10(6) of SEBI (SAST) Regulations 2011
19-Jun-2026 | Source : BSEThe Exchange has received the disclosure under Regulation 10(6) of SEBI (Substantial Acquisition of Shares & Takeovers) Regulations 2011 for Vinita Singhania & Others
Corporate Actions

No Upcoming Board Meetings

Bengal & Assam Company Ltd has declared 500% dividend, ex-date: 22 Sep 25

No Splits history available

No Bonus history available

No Rights history available
Quality key factors
Valuation key factors
Technicals key factors
 Technical Indicator Scale: Bearish, Mildly Bearish, Sideways, Mildly Bullish, Bullish Turned
 Shareholding Snapshot : Mar 2026
Shareholding Compare (%holding)
Promoters
None
Held by 7 Schemes (0.0%)
Held by 17 FIIs (4.43%)
Hari Shankar Singhania Holdings Pvt. Ltd. (23.23%)
Edgefield Securities Limited (2.84%)
11.5%
Quarterly Results Snapshot (Consolidated) - Mar'26 - YoY

YoY Growth in quarter ended Mar 2026 is 20.94% vs -0.31% in Mar 2025
YoY Growth in quarter ended Mar 2026 is -9.02% vs -28.31% in Mar 2025
Half Yearly Results Snapshot (Consolidated) - Sep'25
Growth in half year ended Sep 2025 is 8.75% vs -87.03% in Sep 2024
Growth in half year ended Sep 2025 is 24.06% vs -39.20% in Sep 2024
Nine Monthly Results Snapshot (Consolidated) - Dec'25
YoY Growth in nine months ended Dec 2025 is 8.70% vs -87.04% in Dec 2024
YoY Growth in nine months ended Dec 2025 is 21.93% vs -85.79% in Dec 2024
Annual Results Snapshot (Consolidated) - Mar'26
YoY Growth in year ended Mar 2026 is 11.70% vs -83.53% in Mar 2025
YoY Growth in year ended Mar 2026 is 12.43% vs -81.18% in Mar 2025
About Bengal & Assam Company Ltd

Company Coordinates


