
Compare GTV Engineering with Similar Stocks
Dashboard
High Management Efficiency with a high ROE of 15.63%
Company has a Debt to Equity ratio (avg) of 0.08 times
Healthy long term growth as Operating profit has grown by an annual rate 78.44%
Flat results in Mar 26
With ROE of 23.3, it has a Very Expensive valuation with a 6.8 Price to Book Value
Majority shareholders : Promoters
Consistent Returns over the last 3 years
Stock DNA
Industrial Manufacturing
INR 383 Cr (Micro Cap)
29.00
37
0.12%
0.03
23.29%
6.29
Total Returns (Price + Dividend) 
Latest dividend: 0.09919874087852339 per share ex-dividend date: Sep-22-2025
Risk Adjusted Returns v/s
Returns Beta

News

GTV Engineering Ltd is Rated Hold by MarketsMOJO
GTV Engineering Ltd is rated 'Hold' by MarketsMOJO, a rating that was last updated on 01 Feb 2026. While this rating change occurred earlier this year, the analysis and financial metrics discussed here reflect the company’s current position as of 10 June 2026, providing investors with the most up-to-date insight into the stock’s performance and outlook.
Read full news article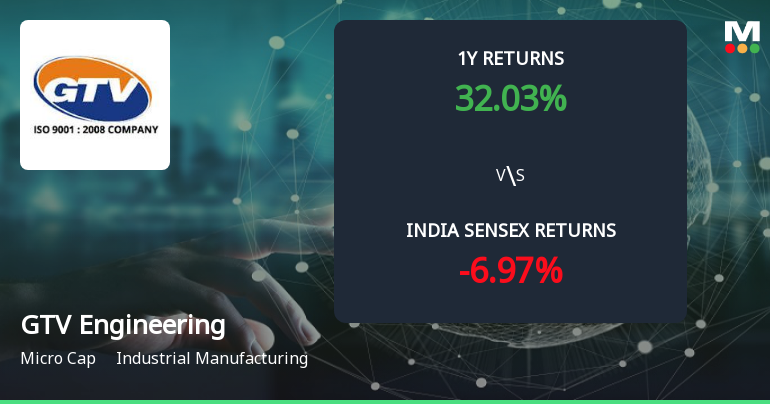
Golden Cross Forms in GTV Engineering Ltd — On a Day the Stock Gained 0.45%. What the Mixed Signals Mean
The 50-day moving average has crossed above the 200-day moving average for GTV Engineering Ltd, signalling a golden cross on 27 May 2026. Yet, the stock’s modest 0.45% gain on the day and a mixed technical backdrop suggest the signal warrants a nuanced interpretation rather than straightforward optimism.
Read full news article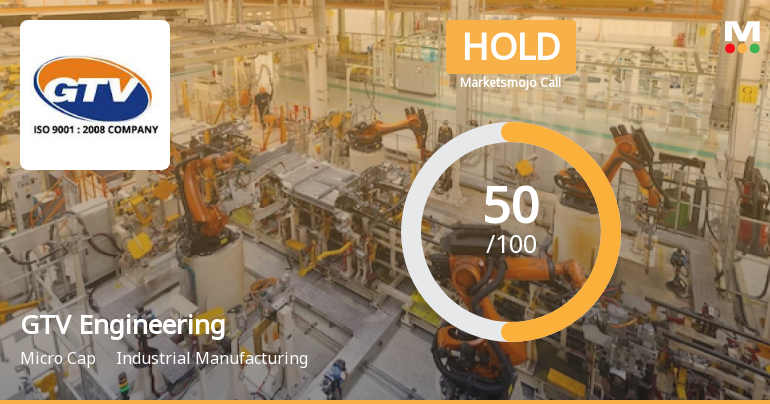
GTV Engineering Ltd is Rated Hold by MarketsMOJO
GTV Engineering Ltd is rated 'Hold' by MarketsMOJO, with this rating last updated on 01 Feb 2026. However, the analysis and financial metrics discussed here reflect the company’s current position as of 27 May 2026, providing investors with the latest insights into its performance and outlook.
Read full news article Announcements
Update On Institutional Investors Meeting.
08-Jun-2026 | Source : BSEUpdate on Institutional Investors Meeting.
Board Meeting Outcome for Outcome Of Board Meeting For Allotment Of Equity Shares On Preferential Basis.
04-Jun-2026 | Source : BSEOutcome of Board Meeting for Allotment of Equity Shares on Preferential Basis for consideration other than cash.
Intimation Regarding Receipt Of In-Principal Approval For Preferential Issue Of Equity Shares On Share Swap Basis.
29-May-2026 | Source : BSEIntimation regarding receipt of In-Principal Approval for Preferential Issue of Equity Shares on Share Swap Basis.
Corporate Actions

No Upcoming Board Meetings

GTV Engineering Ltd has declared 5% dividend, ex-date: 22 Sep 25

GTV Engineering Ltd has announced 2:10 stock split, ex-date: 28 Jul 25

GTV Engineering Ltd has announced 2:1 bonus issue, ex-date: 28 Jul 25

No Rights history available
Quality key factors
Valuation key factors
Technicals key factors
 Technical Indicator Scale: Bearish, Mildly Bearish, Sideways, Mildly Bullish, Bullish Turned
 Shareholding Snapshot : Mar 2026
Shareholding Compare (%holding)
Promoters
None
Held by 0 Schemes
Held by 0 FIIs
Mahesh Agrawal (35.53%)
Rohit Dharampal Gupta (3.38%)
32.98%
Quarterly Results Snapshot (Standalone) - Mar'26 - YoY

YoY Growth in quarter ended Mar 2026 is 42.74% vs -30.18% in Mar 2025

YoY Growth in quarter ended Mar 2026 is -27.67% vs 84.55% in Mar 2025
Half Yearly Results Snapshot (Standalone) - Sep'25
Growth in half year ended Sep 2025 is -27.08% vs -11.42% in Sep 2024
Growth in half year ended Sep 2025 is 122.22% vs 82.61% in Sep 2024
Nine Monthly Results Snapshot (Standalone) - Dec'25
YoY Growth in nine months ended Dec 2025 is -13.46% vs -9.23% in Dec 2024
YoY Growth in nine months ended Dec 2025 is 64.59% vs 119.16% in Dec 2024
Annual Results Snapshot (Standalone) - Mar'26
YoY Growth in year ended Mar 2026 is -1.22% vs -14.80% in Mar 2025
YoY Growth in year ended Mar 2026 is 28.69% vs 104.25% in Mar 2025
About GTV Engineering Ltd

Company Coordinates


