
Compare E2E Networks with Similar Stocks
Dashboard
Strong ability to service debt as the company has a low Debt to EBITDA ratio of 1.26 times
Poor long term growth as Operating profit has grown by an annual rate -270.38% of over the last 5 years
The company has declared positive results in Mar'2026 after 3 consecutive negative quarters
Risky - Negative Operating Profits
60.39% of Promoter Shares are Pledged
Below par performance in long term as well as near term
Stock DNA
IT - Hardware
INR 7,067 Cr (Small Cap)
NA (Loss Making)
35
0.00%
-0.12
-0.92%
4.00
Total Returns (Price + Dividend) 
E2E Networks for the last several years.
Risk Adjusted Returns v/s
Returns Beta

News
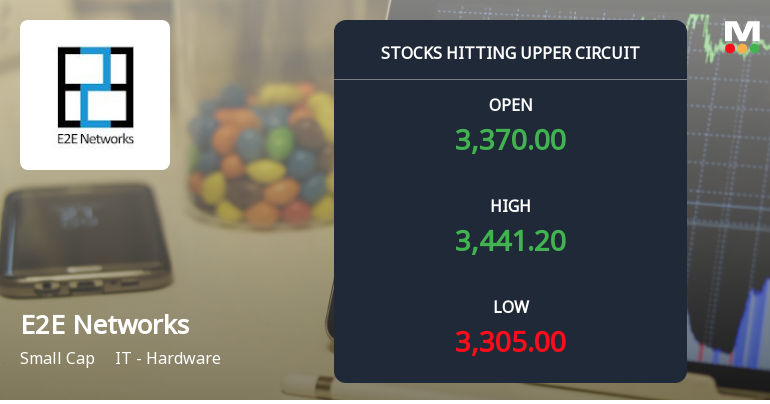
A 5.0% Single-Day Surge Takes E2E Networks Ltd to Its Upper Circuit Limit of Rs 3441.2
At Rs 3441.2, the buying was done — not because demand dried up, but because the exchange wouldn't let the stock go any higher. E2E Networks Ltd locked at its upper circuit of 5.0% on 08 Jun 2026, with buyers queuing and no sellers willing to part with shares.
Read full news article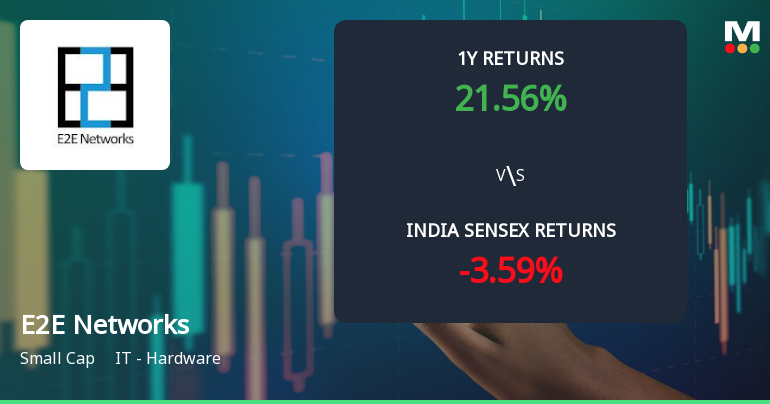
E2E Networks Ltd Shows Renewed Momentum Amid Mixed Technical Signals
E2E Networks Ltd, a small-cap player in the IT - Hardware sector, has demonstrated a notable shift in technical momentum, supported by a robust price rally and improved technical indicators. The stock’s recent upgrade from a Sell to a Hold rating by MarketsMOJO reflects growing investor confidence amid mixed but increasingly positive technical signals.
Read full news article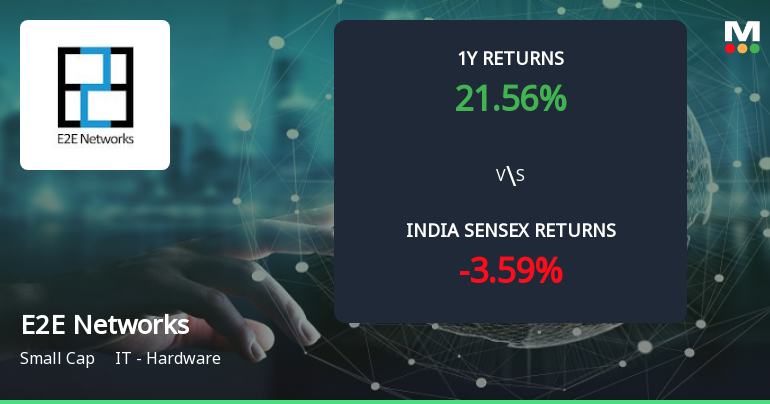
E2E Networks Ltd Forms Golden Cross Amid Mixed Technical Signals and Strong Recent Rally
The 50-day moving average for E2E Networks Ltd has crossed above the 200-day moving average, creating a golden cross on 7 May 2026. Yet, this technical milestone arrives alongside a complex backdrop of mixed momentum indicators and a strong recent price rally, raising questions about the signal’s reliability in isolation.
Read full news article Announcements
Corporate Actions

No Upcoming Board Meetings

No Dividend history available

No Splits history available

No Bonus history available

No Rights history available
Quality key factors
Valuation key factors
Technicals key factors
 Technical Indicator Scale: Bearish, Mildly Bearish, Sideways, Mildly Bullish, Bullish Turned
 Shareholding Snapshot : Mar 2026
Shareholding Compare (%holding)
Non Institution
60.3871
Held by 3 Schemes (4.19%)
Held by 15 FIIs (0.91%)
Tarun Dua (36.31%)
Larsen And Toubro Limited (18.45%)
28.44%
Quarterly Results Snapshot (Standalone) - Mar'26 - QoQ

QoQ Growth in quarter ended Mar 2026 is 36.59% vs 59.86% in Dec 2025

QoQ Growth in quarter ended Mar 2026 is 212.98% vs 57.65% in Dec 2025
Half Yearly Results Snapshot (Standalone) - Sep'25
Growth in half year ended Sep 2025 is -10.08% vs 116.20% in Sep 2024
Growth in half year ended Sep 2025 is -173.13% vs 74.69% in Sep 2024
Nine Monthly Results Snapshot (Standalone) - Dec'25
YoY Growth in nine months ended Dec 2025 is 14.91% vs 100.55% in Dec 2024
YoY Growth in nine months ended Dec 2025 is -164.94% vs 84.73% in Dec 2024
Annual Results Snapshot (Standalone) - Mar'26
YoY Growth in year ended Mar 2026 is 49.78% vs 73.58% in Mar 2025
YoY Growth in year ended Mar 2026 is -132.79% vs 117.15% in Mar 2025
About E2E Networks Ltd

Company Coordinates


