
Compare E2E Networks with Similar Stocks
Dashboard
Strong ability to service debt as the company has a low Debt to EBITDA ratio of 1.26 times
Poor long term growth as Operating profit has grown by an annual rate -270.38% of over the last 5 years
The company has declared positive results in Mar'2026 after 3 consecutive negative quarters
Risky - Negative Operating Profits
60.39% of Promoter Shares are Pledged
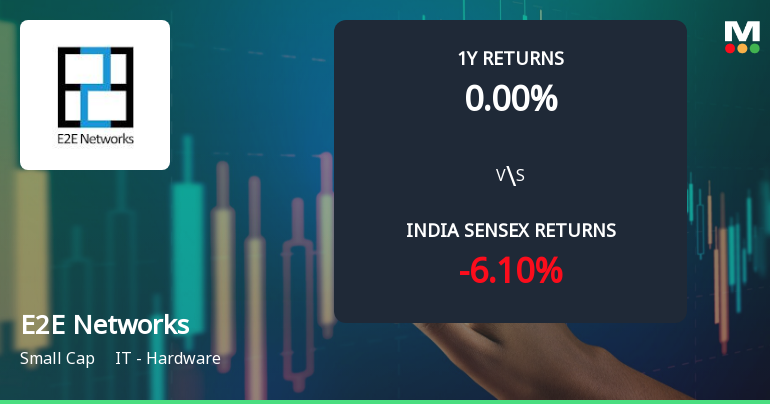
Consistent Returns over the last 3 years
Stock DNA
IT - Hardware
INR 7,917 Cr (Small Cap)
NA (Loss Making)
32
0.00%
-0.12
-0.92%
4.67
Total Returns (Price + Dividend) 
E2E Networks for the last several years.
Risk Adjusted Returns v/s
Returns Beta

News
E2E Networks Ltd Technical Momentum Shifts Amid Mixed Market Signals
E2E Networks Ltd has experienced a subtle shift in its technical momentum, moving from a bullish to a mildly bullish stance as of mid-June 2026. While key indicators such as the MACD and moving averages maintain positive signals, divergences in volume-based metrics and oscillators suggest a nuanced outlook for this small-cap IT hardware stock.
Read full news article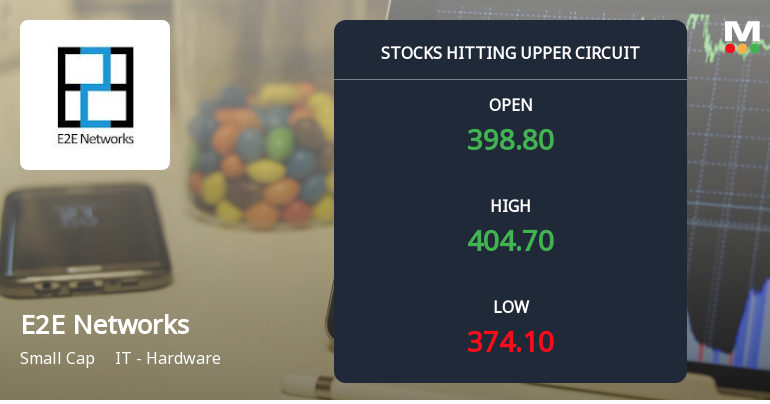
E2E Networks Ltd Locks at Upper Circuit With 5% Gain — Buyers Queue, Sellers Absent
At Rs 405.7, the buying was done — not because demand dried up, but because the exchange wouldn't let the stock go any higher. E2E Networks Ltd locked at its upper circuit of 5% on 15 Jun 2026, with buyers queuing and no sellers willing to part with shares.
Read full news article
E2E Networks Ltd is Rated Hold by MarketsMOJO
E2E Networks Ltd is rated 'Hold' by MarketsMOJO, with this rating last updated on 07 May 2026. However, the analysis and financial metrics discussed here reflect the company’s current position as of 14 June 2026, providing investors with an up-to-date view of the stock’s fundamentals, valuation, financial trends, and technical outlook.
Read full news article Announcements
Corporate Actions

No Upcoming Board Meetings

No Dividend history available

E2E Networks Ltd has announced 1:10 stock split, ex-date: 05 Jun 26

No Bonus history available

No Rights history available
Quality key factors
Valuation key factors
Technicals key factors
 Technical Indicator Scale: Bearish, Mildly Bearish, Sideways, Mildly Bullish, Bullish Turned
 Shareholding Snapshot : Apr 2018
Shareholding Compare (%holding)
Promoters
None
Held by 0 Schemes
Held by 0 FIIs
Tarun Dua (36.31%)
Larsen And Toubro Limited (18.45%)
Quarterly Results Snapshot (Standalone) - Mar'26 - QoQ

QoQ Growth in quarter ended Mar 2026 is 36.59% vs 59.86% in Dec 2025

QoQ Growth in quarter ended Mar 2026 is 212.98% vs 57.65% in Dec 2025
Half Yearly Results Snapshot (Standalone) - Sep'25
Growth in half year ended Sep 2025 is -10.08% vs 116.20% in Sep 2024
Growth in half year ended Sep 2025 is -173.13% vs 74.69% in Sep 2024
Nine Monthly Results Snapshot (Standalone) - Dec'25
YoY Growth in nine months ended Dec 2025 is 14.91% vs 100.55% in Dec 2024
YoY Growth in nine months ended Dec 2025 is -164.94% vs 84.73% in Dec 2024
Annual Results Snapshot (Standalone) - Mar'26
YoY Growth in year ended Mar 2026 is 49.78% vs 73.58% in Mar 2025
YoY Growth in year ended Mar 2026 is -132.79% vs 117.15% in Mar 2025
About E2E Networks Ltd

Company Coordinates


