Laxmi Organic

  • Market Cap: Small Cap
  • Industry: Specialty Chemicals
  • ISIN: INE576O01020
  • NSEID: LXCHEM
  • BSEID: 543277
INR
156.31
4.5 (2.96%)
BSENSE

May 25

BSE+NSE Vol: 3.25 lacs

  • Price Points
  • Score
  • Mojo Parameters
  • Total Return
  • News and Corporate Actions
  • Key factors
  • Shareholding
  • Financials
  • CompanyCV
stock-summaryPrice Point
High/Low

1Day

52 Week

Valuation
Technical
Day's Volume

CASH

3.25 lacs (-1.52%) Volume

Shareholding (Mar 2026)

FII

1.15%

Held by 45 FIIs

DII

3.82%

Held by 6 DIIs

Promoter

69.35%

how big is Laxmi Organic?

06-Jun-2025

As of Jun 06, Laxmi Organic Industries Ltd has a market capitalization of 5,652.00 Cr, with net sales of 2,985.45 Cr and net profit of 113.51 Cr over the latest four quarters. Shareholder's funds are 1,797.62 Cr, and total assets amount to 2,827.22 Cr as of Mar'24.

Market Cap: Laxmi Organic Industries Ltd has a market capitalization of 5,652.00 Cr and is classified as a Mid Cap company as of Jun 06.<BR><BR>Recent Quarterly Performance: The sum of Net Sales for the latest 4 quarters, which includes Mar'25, Dec'24, Sep'24, and Jun'24, is 2,985.45 Cr. The sum of Net Profit for the same period is 113.51 Cr. This data is Consolidated.<BR><BR>Balance Sheet Snapshot: This is Consolidated data for the latest annual period ending Mar'24. Shareholder's Funds are reported at 1,797.62 Cr, and Total Assets amount to 2,827.22 Cr.

View full answer

What does Laxmi Organic do?

06-Jun-2025

Laxmi Organic Industries Ltd is a mid-cap specialty chemicals company that manufactures acetyl intermediates and specialty chemicals. As of March 2025, it reported net sales of ₹710 Cr and a net profit of ₹22 Cr, with a market cap of ₹5,644 Cr.

Overview:<BR>Laxmi Organic Industries Ltd is a mid-cap company in the specialty chemicals industry, primarily engaged in the manufacturing of acetyl intermediates and specialty chemicals.<BR><BR>History:<BR>Laxmi Organic Industries Limited was incorporated on May 15, 1989. The company has been operational since its establishment and reported its latest quarterly results for March 2025, showcasing net sales and profit figures.<BR><BR>Financial Snapshot:<BR>Net Sales: 710 Cr (Quarterly Results - Mar 2025) <BR>Net Profit: 22 Cr (Quarterly Results - Mar 2025) <BR>Market Cap: Rs 5,644 Cr (Mid Cap)<BR><BR>Key Metrics:<BR>P/E: 50.00 <BR>Industry P/E: 38 <BR>Dividend Yield: 0.29% <BR>Debt-Equity: 0.00 <BR>Return on Equity: 5.95% <BR>Price to Book: 2.98 <BR><BR>Contact Details:<BR>Details: No Company Details Available <BR>Registrar Address: Not available.

View full answer

Has Laxmi Organic declared dividend?

06-Jun-2025

Laxmi Organic Industries Ltd has declared a 30% dividend, amounting to ₹0.6 per share, with an ex-date of July 19, 2024. Despite this dividend declaration, the company's total returns over various periods have shown significant negative performance.

Laxmi Organic Industries Ltd has declared a 30% dividend.<BR><BR>Dividend Details:<BR>- Percentage announced: 30%<BR>- Amount per share: 0.6<BR>- Ex-date: Jul-19-2024<BR><BR>Dividend Yield: 0.29%<BR><BR>Total Returns by Period:<BR>Over the past 6 months, the price return has been -23.99%, with a dividend return of 0%, resulting in a total return of -23.99%.<BR><BR>In the last year, the price return was -14.55%, the dividend return was 0.24%, leading to a total return of -14.31%.<BR><BR>Over a 2-year period, the price return stood at -25.02%, with a dividend return of 0.41%, culminating in a total return of -24.61%.<BR><BR>For the 3-year period, the price return was -42.52%, while the dividend return was 0.61%, resulting in a total return of -41.91%.<BR><BR>In the 4-year timeframe, the price return was -7.67%, with a dividend return of 1.04%, leading to a total return of -6.63%.<BR><BR>Over the last 5 years, the price return was 0%, and the dividend return was 0%, resulting in a total return of 0.0%.<BR><BR>Overall, while Laxmi Organic has declared a dividend, the total returns over various periods indicate significant negative performance, particularly in the longer term, suggesting challenges in the company's stock performance despite the dividend declaration.

View full answer

Who are the peers of the Laxmi Organic?

16-Jul-2025

Laxmi Organic's peers include Archean Chemical, Epigral, Balaji Amines, and others, with varying management risks and growth rates. Camlin Fine has the highest 1-year return at 141.62%, while Laxmi Organic's return is -23.87%.

Peers: The peers of Laxmi Organic are Archean Chemical, Epigral, Balaji Amines, Styrenix Perfor., Camlin Fine, Neogen Chemicals, Rossari Biotech, Vishnu Chemicals, S H Kelkar & Co., and Nocil.<BR><BR>Quality Snapshot: Excellent management risk is observed at Archean Chemical, Styrenix Perfor., Neogen Chemicals, and Rossari Biotech, while Good management risk is found at Epigral, Vishnu Chemicals, and the rest. Average management risk is present at Balaji Amines, Laxmi Organic, S H Kelkar & Co., and the rest. Below Average management risk is noted at Camlin Fine, while the rest have Below Average growth, except for Styrenix Perfor. and Vishnu Chemicals, which have Good growth.<BR><BR>Return Snapshot: The peer with the highest 1-year return is Camlin Fine at 141.62%, while the lowest is Balaji Amines at -23.79%, which is also lower than Laxmi Organic's own 1-year return of -23.87%. Additionally, the peers with negative six-month returns include Laxmi Organic, Rossari Biotech, Neogen Chemicals, and Nocil.

View full answer

Who are in the management team of Laxmi Organic?

16-Jul-2025

As of March 2023, Laxmi Organic's management team includes Ravi Goenka (Chairman & Managing Director), Satej Nabar (Executive Director & CEO), and several independent directors, overseeing the company's operations and strategy.

As of March 2023, the management team of Laxmi Organic includes:<BR><BR>1. Ravi Goenka - Chairman & Managing Director<BR>2. Satej Nabar - Executive Director & CEO<BR>3. Harshvardhan Goenka - Executive Director<BR>4. Rajeev Goenka - Non Executive Director<BR>5. Manish Chokhani - Independent Director<BR>6. O V Bundellu - Independent Director<BR>7. Sangeeta Singh - Independent Director<BR>8. Rajeev Vaidya - Independent Director<BR>9. Aniket Hirpara - Company Secretary & Compliance Officer<BR>10. Rajiv Banavali - Independent Director<BR><BR>This team is responsible for overseeing the operations and strategic direction of the company.

View full answer

Who are the top shareholders of the Laxmi Organic?

17-Jul-2025

The top shareholders of Laxmi Organic include Yellowstone Trust with 63.79%, mutual funds holding 3.29%, Foreign Institutional Investors at 2.48%, and individual investors collectively owning 20.84%. The highest public shareholder is ICICI Prudential Multicap Fund with 1.68%.

The top shareholders of Laxmi Organic include a majority of promoters, with Yellowstone Trust holding the largest share at 63.79%. Additionally, mutual funds have a presence through 8 schemes, collectively holding 3.29%. Foreign Institutional Investors (FIIs) own 2.48% of the company, represented by 79 different FIIs. The highest public shareholder is ICICI Prudential Multicap Fund, which holds 1.68%. Individual investors collectively hold 20.84% of the shares.

View full answer

Is Laxmi Organic overvalued or undervalued?

11-Aug-2025

As of August 8, 2025, Laxmi Organic is considered overvalued with a PE ratio of 50.98 and underperformance against the Sensex, indicating a shift from fair to expensive valuation.

As of 8 August 2025, Laxmi Organic has moved from a fair to an expensive valuation grade. The company is currently considered overvalued, with a PE ratio of 50.98, an EV to EBITDA ratio of 21.40, and a Price to Book Value of 2.69. These figures indicate a significant premium compared to its peers, such as UPL, which has a PE of 34.42 and an EV to EBITDA of 8.48, and Sharda Cropchem, with a PE of 21.01 and an EV to EBITDA of 11.49.<BR><BR>The company's financial performance metrics, including a ROCE of 8.19% and an ROE of 5.95%, suggest that it is not generating sufficient returns relative to its high valuation. Additionally, Laxmi Organic's stock has underperformed against the Sensex, with a year-to-date return of -23.85% compared to the Sensex's 2.20%. This further reinforces the view that the stock is overvalued in the current market environment.

View full answer

How has been the historical performance of Laxmi Organic?

03-Nov-2025

Laxmi Organic has shown fluctuating financial performance, with net sales increasing from 1,534.12 Cr in Mar'20 to 2,985.44 Cr in Mar'25, despite a peak in profits in Mar'22 followed by declines in subsequent years. The company has expanded significantly, but rising costs and decreasing profitability have tempered growth.

Answer:<BR>The historical performance of Laxmi Organic shows a fluctuating trend in net sales and profits over the years, with a notable peak in Mar'22.<BR><BR>Breakdown:<BR>Laxmi Organic's net sales have shown an overall increase from Mar'20 to Mar'25, rising from 1,534.12 Cr in Mar'20 to 2,985.44 Cr in Mar'25, despite a dip in Mar'22. The total operating income followed a similar pattern, reaching 2,985.44 Cr in Mar'25. The raw material cost has also increased significantly, from 780.96 Cr in Mar'20 to 1,915.45 Cr in Mar'25, reflecting the company's growing operational scale. Operating profit (PBDIT) peaked at 382.41 Cr in Mar'22 but has since declined to 305.00 Cr in Mar'25. Profit before tax has also seen fluctuations, with a high of 318.89 Cr in Mar'22 and a decrease to 160.52 Cr in Mar'25. Profit after tax has similarly decreased from 257.45 Cr in Mar'22 to 113.50 Cr in Mar'25. The total assets of the company have grown from 1,069.37 Cr in Mar'20 to 3,044.58 Cr in Mar'25, indicating significant expansion. However, total liabilities have also increased, from 1,069.37 Cr in Mar'20 to 3,044.58 Cr in Mar'25. Cash flow from operating activities has decreased from 561.00 Cr in Mar'24 to 107.00 Cr in Mar'25, while cash flow from investing activities has been negative, indicating ongoing investments. Overall, Laxmi Organic's financial performance reflects a period of growth tempered by rising costs and fluctuating profitability.

View full answer

Is Laxmi Organic technically bullish or bearish?

04-Nov-2025

As of November 3, 2025, Laxmi Organic's technical trend is mildly bearish, supported by bearish MACD and Bollinger Bands, despite some mildly bullish daily moving averages.

As of 3 November 2025, the technical trend for Laxmi Organic has changed from sideways to mildly bearish. The weekly MACD is bearish, and the monthly MACD is mildly bearish, indicating a negative momentum. The Bollinger Bands also reflect a mildly bearish stance on both weekly and monthly time frames. The KST shows a mildly bearish signal weekly and bearish monthly, further supporting the bearish outlook. Although the daily moving averages are mildly bullish, they are overshadowed by the overall bearish indicators. The lack of trends in Dow Theory and OBV suggests uncertainty in the market. Overall, the current technical stance is mildly bearish, driven primarily by the MACD and Bollinger Bands.

View full answer

When is the next results date for Laxmi Organic Industries Ltd?

06-May-2026

The next results date for Laxmi Organic Industries Ltd is 21 May 2026.

The next results date for Laxmi Organic Industries Ltd is scheduled for 21 May 2026.

View full answer

Are Laxmi Organic Industries Ltd latest results good or bad?

22-May-2026

Laxmi Organic Industries Ltd's latest results are mixed but lean negative, with a slight revenue increase of 3.61% to ₹735.31 crores in Q4 FY26, while net profit declined by 0.97% year-on-year and operating margins fell to 7.29%. Overall, the company faces significant operational challenges, as evidenced by a 26.76% drop in annual net profit despite stable revenues.

Laxmi Organic Industries Ltd's latest results present a mixed picture, leaning towards the negative. In the fourth quarter of FY26, the company achieved its highest quarterly revenue of ₹735.31 crores, reflecting a year-on-year growth of 3.61%. However, this revenue growth did not translate into improved profitability. The net profit for the quarter was ₹21.55 crores, which represents a decline of 0.97% compared to the same period last year and a significant drop of 15.19% from the previous quarter.<BR><BR>Operating margins also contracted sharply, falling to 7.29% from 8.31% in the previous year. This decline in margins indicates ongoing challenges in managing costs effectively, which is concerning for a company in the specialty chemicals sector. Additionally, for the full financial year FY26, the consolidated net profit saw a substantial decline of 26.76% compared to the previous year, despite stable revenue figures.<BR><BR>Overall, while the revenue figures are a positive aspect, the decline in net profit and operating margins suggests that Laxmi Organic is facing significant operational challenges and margin pressures, making the latest results more unfavorable than favorable.

View full answer

Should I buy, sell or hold Laxmi Organic Industries Ltd?

23-May-2026

Why is Laxmi Organic Industries Ltd falling/rising?

25-May-2026

As of 24-May, Laxmi Organic Industries Ltd's stock price is declining, currently at 151.70, with a significant underperformance against benchmarks and poor financial metrics, including a low Return on Equity and a notable decrease in profit after tax. The stock has consistently underperformed over the past year and three years, contributing to negative market sentiment.

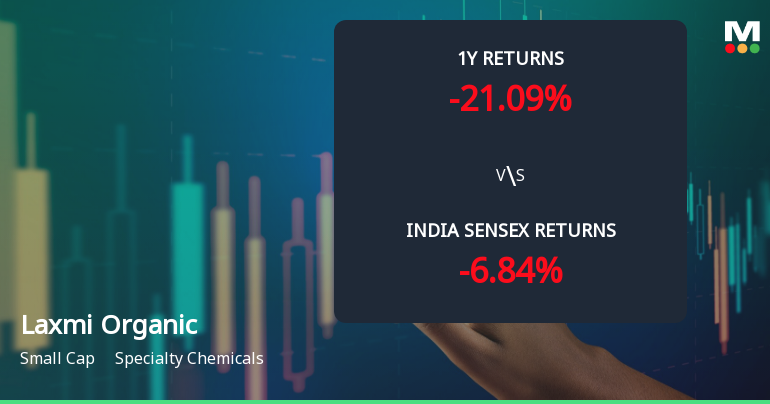
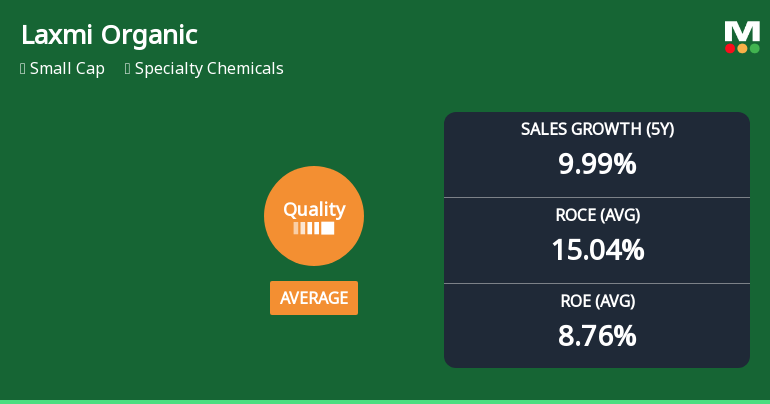
As of 24-May, Laxmi Organic Industries Ltd's stock price is falling, currently at 151.70, reflecting a change of -7.3 (-4.59%). The stock has underperformed the sector today by -4.96% and opened with a loss of -2.52%. It has also experienced a trend reversal, falling after three consecutive days of gains. The stock touched an intraday low of Rs 150.8, which is a decline of -5.16%.<BR><BR>In terms of performance against benchmarks, the stock has shown consistent underperformance over the past year, generating returns of -21.09%, while the BSE500 benchmark has only declined by -6.84%. Over the last three years, the stock has significantly underperformed, with a decline of -39.74% compared to a +21.71% increase in the benchmark.<BR><BR>Financially, the company exhibits poor management efficiency, with a low Return on Equity (ROE) of 8.76%, indicating low profitability per unit of shareholders' funds. Additionally, the operating profit has decreased at an annual rate of -11.05% over the last five years, and the latest financial results show a decline in profit after tax (PAT) of -26.76%. The company's cash and cash equivalents are at their lowest, further contributing to negative sentiment around the stock.<BR><BR>Overall, the combination of poor financial performance, consistent underperformance against benchmarks, and negative market sentiment are key factors contributing to the decline in Laxmi Organic Industries Ltd's stock price.

View full answer
iScoreScore
Click here to find our call on this stock
Strong Sell
Sell
Hold
Buy
Strong Buy

Dashboard

1

Poor Management Efficiency with a low ROE of 8.76%

  • The company has been able to generate a Return on Equity (avg) of 8.76% signifying low profitability per unit of shareholders funds
2

Poor long term growth as Operating profit has grown by an annual rate -11.05% of over the last 5 years

 
3

Flat results in Mar 26

4

With ROE of 4.3, it has a Very Expensive valuation with a 2.2 Price to Book Value

5

Consistent Underperformance against the benchmark over the last 3 years

stock-summaryMojo Parameters

Mojo Parameters

Loading Valuation Snapshot...

Stock DNA

stock-summary
Industry

Specialty Chemicals

stock-summary
Market cap

INR 4,333 Cr (Small Cap)

stock-summary
P/E

53.00

stock-summary
Industry P/E

29

stock-summary
Dividend Yield

0.33%

stock-summary
Debt Equity

0.10

stock-summary
Return on Equity

4.33%

stock-summary
Price to Book

2.18

Revenue and Profits:
Net Sales:
735 Cr
(Quarterly Results - Mar 2026)
Net Profit:
22 Cr
stock-summaryTotal Returns
Total Returns (Price + Dividend) stock-summary
Dividend Yield (0.33%)
TimePeriod
Price Return
Dividend Return
Total Return
3 Months
19.68%
0%
19.68%
6 Months
-14.58%
0%
-14.58%
1 Year
-19.88%
0.25%
-19.63%
2 Years
-37.98%
0.49%
-37.49%
3 Years
-39.13%
0.60%
-38.53%
4 Years
-54.14%
0.72%
-53.42%
5 Years
-33.09%
1.25%
-31.84%

Latest dividend: 0.5 per share ex-dividend date: Jul-18-2025

Risk Adjusted Returns v/s stock-summary
Returns Beta
Icon
Beta has not been calculated since enough price history is not available
stock-summaryNews & Corporate Actions

News

stock-summaryKey Factors

Quality key factors stock-summary

Factor
Value
Sales Growth (5y)
9.99%
EBIT Growth (5y)
-11.05%
EBIT to Interest (avg)
14.30
Debt to EBITDA (avg)
0.83
Net Debt to Equity (avg)
0.10
Sales to Capital Employed (avg)
1.63
Tax Ratio
9.79%
Dividend Payout Ratio
13.73%
Pledged Shares
0
Institutional Holding
4.97%
ROCE (avg)
15.04%
ROE (avg)
8.76%

Valuation key factors

Factor
Value
P/E Ratio
53
Industry P/E
29
Price to Book Value
2.18
EV to EBIT
46.44
EV to EBITDA
25.68
EV to Capital Employed
2.08
EV to Sales
1.55
PEG Ratio
NA
Dividend Yield
0.33%
ROCE (Latest)
4.43%
ROE (Latest)
4.33%

Technicals key factors

Indicator
Weekly
Monthly
MACD
Mildly Bullish
Bearish
RSI
No Signal
No Signal
Bollinger Bands
Mildly Bullish
Mildly Bearish
Moving Averages
Mildly Bearish (Daily)
KST
Mildly Bullish
Bearish
Dow Theory
Mildly Bullish
Mildly Bullish
OBV
Bullish
Bullish
stock-summary Technical Indicator Scale: Bearish, Mildly Bearish, Sideways, Mildly Bullish, Bullish  Turned 
stock-summaryShareholding
Shareholding Snapshot : Mar 2026stock-summary
Shareholding Compare (%holding) stock-summary
Majority shareholders

Promoters

Pledged Promoter Holdings

None

Mutual Funds

Held by 7 Schemes (3.32%)

FIIs

Held by 45 FIIs (1.15%)

Promoter with highest holding

Yellow Stone Trust (63.76%)

Highest Public shareholder

Icici Prudential Multicap Fund (3.21%)

Individual Investors Holdings

22.19%

stock-summaryFinancial
[
  {
    "link": "quarterly",
    "btn_text": "All Quarterly Results",
    "header": "Quarterly Results Snapshot (Consolidated) - Mar'26 - QoQ",
    "rhs": [
      {
        "prefix": "Net Sales ",
        "suffix": "QoQ Growth in quarter ended Mar 2026 is 2.31% vs 2.71% in Dec 2025",
        "dir": -1
      },
      {
        "prefix": "Consolidated Net Profit ",
        "suffix": "QoQ Growth in quarter ended Mar 2026 is -15.19% vs 130.58% in Dec 2025",
        "dir": -1
      }
    ],
    "table": {
      "header": [
        "Mar'26",
        "Dec'25",
        "Change(%)"
      ],
      "body": [
        {
          "field": "Net Sales",
          "val1": "735.31",
          "val2": "718.68",
          "chgp": "2.31%",
          "chgp_class": "positive"
        },
        {
          "field": "Operating Profit (PBDIT) excl Other Income",
          "val1": "53.63",
          "val2": "49.92",
          "chgp": "7.43%",
          "chgp_class": "positive"
        },
        {
          "field": "Interest",
          "val1": "4.68",
          "val2": "6.80",
          "chgp": "-31.18%",
          "chgp_class": "positive"
        },
        {
          "field": "Exceptional Items",
          "val1": "0.00",
          "val2": "0.00",
          "chgp": "",
          "chgp_class": "neutral"
        },
        {
          "field": "Consolidate Net Profit",
          "val1": "21.55",
          "val2": "25.41",
          "chgp": "-15.19%",
          "chgp_class": "negative"
        },
        {
          "field": "Operating Profit Margin (Excl OI)",
          "val1": "7.29%",
          "val2": "6.95%",
          "chgp": "0.34%",
          "chgp_class": "positive"
        }
      ]
    }
  },
  {
    "link": "half-yearly",
    "btn_text": "All Half Yearly Results",
    "header": "Half Yearly Results Snapshot (Consolidated) - Sep'25",
    "rhs": [
      {
        "prefix": "Net Sales ",
        "suffix": " Growth in half year ended Sep 2025 is -6.50% vs 7.81% in Sep 2024",
        "dir": -1
      },
      {
        "prefix": "Consolidated Net Profit ",
        "suffix": " Growth in half year ended Sep 2025 is -48.09% vs 27.32% in Sep 2024",
        "dir": -1
      }
    ],
    "table": {
      "header": [
        "Sep'25",
        "Sep'24",
        "Change(%)"
      ],
      "body": [
        {
          "field": "Net Sales",
          "val1": "1,392.68",
          "val2": "1,489.42",
          "chgp": "-6.50%",
          "chgp_class": "negative"
        },
        {
          "field": "Operating Profit (PBDIT) excl Other Income",
          "val1": "67.84",
          "val2": "145.89",
          "chgp": "-53.50%",
          "chgp_class": "negative"
        },
        {
          "field": "Interest",
          "val1": "10.62",
          "val2": "10.96",
          "chgp": "-3.10%",
          "chgp_class": "positive"
        },
        {
          "field": "Exceptional Items",
          "val1": "0.00",
          "val2": "0.00",
          "chgp": "",
          "chgp_class": "neutral"
        },
        {
          "field": "Consolidate Net Profit",
          "val1": "32.41",
          "val2": "62.44",
          "chgp": "-48.09%",
          "chgp_class": "negative"
        },
        {
          "field": "Operating Profit Margin (Excl OI)",
          "val1": "4.87%",
          "val2": "9.80%",
          "chgp": "-4.93%",
          "chgp_class": "negative"
        }
      ]
    }
  },
  {
    "link": "nine-monthly",
    "btn_text": "All Nine Monthly Results",
    "header": "Nine Monthly Results Snapshot (Consolidated) - Dec'25",
    "rhs": [
      {
        "prefix": "Net Sales ",
        "suffix": "YoY Growth in nine months ended Dec 2025 is -7.22% vs 9.63% in Dec 2024",
        "dir": -1
      },
      {
        "prefix": "Consolidated Net Profit ",
        "suffix": "YoY Growth in nine months ended Dec 2025 is -36.98% vs 20.36% in Dec 2024",
        "dir": -1
      }
    ],
    "table": {
      "header": [
        "Dec'25",
        "Dec'24",
        "Change(%)"
      ],
      "body": [
        {
          "field": "Net Sales",
          "val1": "2,111.36",
          "val2": "2,275.76",
          "chgp": "-7.22%",
          "chgp_class": "negative"
        },
        {
          "field": "Operating Profit (PBDIT) excl Other Income",
          "val1": "117.76",
          "val2": "220.66",
          "chgp": "-46.63%",
          "chgp_class": "negative"
        },
        {
          "field": "Interest",
          "val1": "17.42",
          "val2": "13.12",
          "chgp": "32.77%",
          "chgp_class": "negative"
        },
        {
          "field": "Exceptional Items",
          "val1": "0.00",
          "val2": "0.00",
          "chgp": "",
          "chgp_class": "neutral"
        },
        {
          "field": "Consolidate Net Profit",
          "val1": "57.82",
          "val2": "91.75",
          "chgp": "-36.98%",
          "chgp_class": "negative"
        },
        {
          "field": "Operating Profit Margin (Excl OI)",
          "val1": "5.58%",
          "val2": "9.70%",
          "chgp": "-4.12%",
          "chgp_class": "negative"
        }
      ]
    }
  },
  {
    "link": "annual",
    "btn_text": "All Annual Results",
    "header": "Annual Results Snapshot (Consolidated) - Mar'26",
    "rhs": [
      {
        "prefix": "Net Sales ",
        "suffix": "YoY Growth in year ended Mar 2026 is -4.65% vs 4.20% in Mar 2025",
        "dir": -1
      },
      {
        "prefix": "Consolidated Net Profit ",
        "suffix": "YoY Growth in year ended Mar 2026 is -30.08% vs -5.84% in Mar 2025",
        "dir": -1
      }
    ],
    "table": {
      "header": [
        "Mar'26",
        "Mar'25",
        "Change(%)"
      ],
      "body": [
        {
          "field": "Net Sales",
          "val1": "2,846.67",
          "val2": "2,985.44",
          "chgp": "-4.65%",
          "chgp_class": "negative"
        },
        {
          "field": "Operating Profit (PBDIT) excl Other Income",
          "val1": "171.40",
          "val2": "279.64",
          "chgp": "-38.71%",
          "chgp_class": "negative"
        },
        {
          "field": "Interest",
          "val1": "22.09",
          "val2": "20.45",
          "chgp": "8.02%",
          "chgp_class": "negative"
        },
        {
          "field": "Exceptional Items",
          "val1": "0.00",
          "val2": "0.00",
          "chgp": "",
          "chgp_class": "neutral"
        },
        {
          "field": "Consolidate Net Profit",
          "val1": "79.36",
          "val2": "113.50",
          "chgp": "-30.08%",
          "chgp_class": "negative"
        },
        {
          "field": "Operating Profit Margin (Excl OI)",
          "val1": "6.02%",
          "val2": "9.37%",
          "chgp": "-3.35%",
          "chgp_class": "negative"
        }
      ]
    }
  }
]

Quarterly Results Snapshot (Consolidated) - Mar'26 - QoQstock-summary

Mar'26
Dec'25
Change(%)
Net Sales
735.31
718.68
2.31%
Operating Profit (PBDIT) excl Other Income
53.63
49.92
7.43%
Interest
4.68
6.80
-31.18%
Exceptional Items
0.00
0.00
Consolidate Net Profit
21.55
25.41
-15.19%
Operating Profit Margin (Excl OI)
7.29%
6.95%
0.34%
Values in Rs Cr.
Direction Arrows
Net Sales

QoQ Growth in quarter ended Mar 2026 is 2.31% vs 2.71% in Dec 2025

Direction Arrows
Consolidated Net Profit

QoQ Growth in quarter ended Mar 2026 is -15.19% vs 130.58% in Dec 2025

Half Yearly Results Snapshot (Consolidated) - Sep'25stock-summary

Sep'25
Sep'24
Change(%)
Net Sales
1,392.68
1,489.42
-6.50%
Operating Profit (PBDIT) excl Other Income
67.84
145.89
-53.50%
Interest
10.62
10.96
-3.10%
Exceptional Items
0.00
0.00
Consolidate Net Profit
32.41
62.44
-48.09%
Operating Profit Margin (Excl OI)
4.87%
9.80%
-4.93%
Values in Rs Cr.
Direction Arrows
Net Sales

Growth in half year ended Sep 2025 is -6.50% vs 7.81% in Sep 2024

Direction Arrows
Consolidated Net Profit

Growth in half year ended Sep 2025 is -48.09% vs 27.32% in Sep 2024

Nine Monthly Results Snapshot (Consolidated) - Dec'25stock-summary

Dec'25
Dec'24
Change(%)
Net Sales
2,111.36
2,275.76
-7.22%
Operating Profit (PBDIT) excl Other Income
117.76
220.66
-46.63%
Interest
17.42
13.12
32.77%
Exceptional Items
0.00
0.00
Consolidate Net Profit
57.82
91.75
-36.98%
Operating Profit Margin (Excl OI)
5.58%
9.70%
-4.12%
Values in Rs Cr.
Direction Arrows
Net Sales

YoY Growth in nine months ended Dec 2025 is -7.22% vs 9.63% in Dec 2024

Direction Arrows
Consolidated Net Profit

YoY Growth in nine months ended Dec 2025 is -36.98% vs 20.36% in Dec 2024

Annual Results Snapshot (Consolidated) - Mar'26stock-summary

Mar'26
Mar'25
Change(%)
Net Sales
2,846.67
2,985.44
-4.65%
Operating Profit (PBDIT) excl Other Income
171.40
279.64
-38.71%
Interest
22.09
20.45
8.02%
Exceptional Items
0.00
0.00
Consolidate Net Profit
79.36
113.50
-30.08%
Operating Profit Margin (Excl OI)
6.02%
9.37%
-3.35%
Values in Rs Cr.
Direction Arrows
Net Sales

YoY Growth in year ended Mar 2026 is -4.65% vs 4.20% in Mar 2025

Direction Arrows
Consolidated Net Profit

YoY Growth in year ended Mar 2026 is -30.08% vs -5.84% in Mar 2025

stock-summaryCompany CV
About Laxmi Organic Industries Ltd stock-summary
stock-summary
Laxmi Organic Industries Ltd
Small Cap
Specialty Chemicals
Laxmi Organic Industries Limited is the Goenka Group's flagship company, established in 1989 and is in the business of Acetyl Intermediates and Specialty Chemicals. The Company primarily manufactures Ethyl Acetate, Acetic Acid and Diketene Derivative Products (DDP). DDP is a specialty chemical group, the technology and business of which has been acquired by LOIL from Clariant Chemicals India Limited. Laxmi Organic Industries Limited was incorporated on May 15, 1989.
Company Coordinates stock-summary
Icon
No Company Details Available