
Compare Rategain Travel with Similar Stocks
Dashboard
Company has a Debt to Equity ratio (avg) of 0.07 times
Healthy long term growth as Net Sales has grown by an annual rate of 49.34% and Operating profit at 300.49%
Positive results in Mar 26
High Institutional Holdings at 26.21%
Market Beating performance in long term as well as near term
Stock DNA
Computers - Software & Consulting
INR 9,264 Cr (Small Cap)
41.00
20
0.00%
0.37
11.27%
4.64
Total Returns (Price + Dividend) 
Rategain Travel for the last several years.
Risk Adjusted Returns v/s
Returns Beta

News

Rategain Travel Technologies Ltd Upgraded to Buy on Strong Technical and Financial Performance
Rategain Travel Technologies Ltd has been upgraded from a Hold to a Buy rating, reflecting significant improvements across technical indicators, financial trends, and quality metrics despite a shift to an expensive valuation. The company’s robust quarterly results, market-beating returns, and bullish technical signals have underpinned this positive reassessment by MarketsMOJO as of 10 June 2026.
Read full news article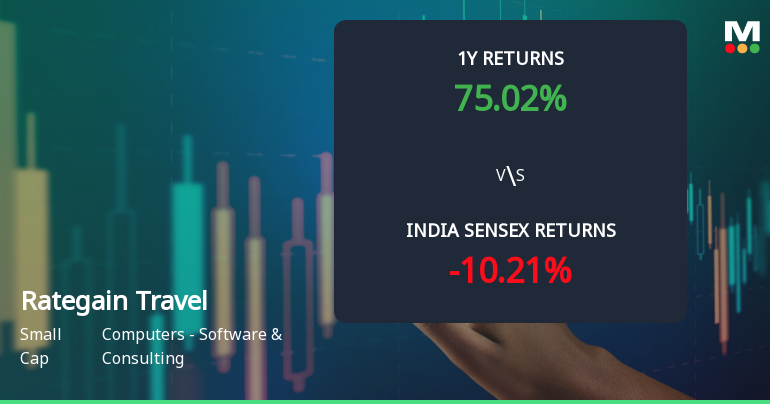
Rategain Travel Technologies Ltd Sees Bullish Momentum Shift Amid Strong Technical Signals
Rategain Travel Technologies Ltd has demonstrated a significant shift in price momentum, supported by a series of bullish technical indicators and an upgraded Mojo Grade from Hold to Buy. The stock’s recent performance outpaces the broader market, signalling renewed investor confidence in this small-cap player within the Computers - Software & Consulting sector.
Read full news article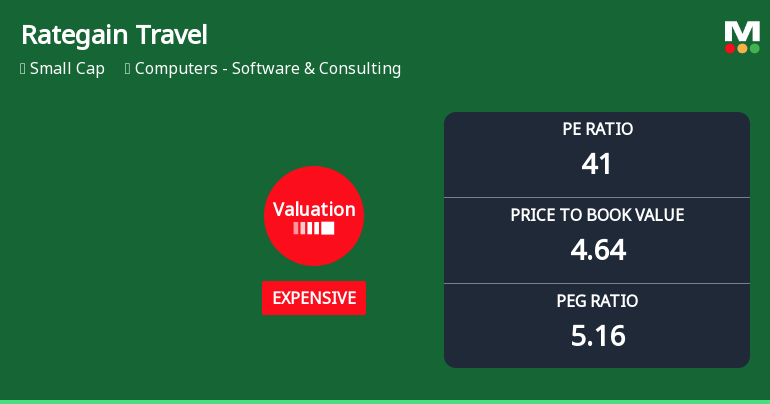
Rategain Travel Technologies Ltd: Valuation Shift Signals Price Attractiveness Change
Rategain Travel Technologies Ltd has witnessed a notable shift in its valuation parameters, moving from fair to expensive territory, reflecting evolving market perceptions and price attractiveness. Despite this, the stock continues to outperform the Sensex across multiple time frames, supported by a recent upgrade in its Mojo Grade to Buy, signalling renewed investor confidence in this small-cap software and consulting firm.
Read full news article Announcements
Corporate Actions

No Upcoming Board Meetings

No Dividend history available

No Splits history available

No Bonus history available

No Rights history available
Quality key factors
Valuation key factors
Technicals key factors
 Technical Indicator Scale: Bearish, Mildly Bearish, Sideways, Mildly Bullish, Bullish Turned
 Shareholding Snapshot : Mar 2026
Shareholding Compare (%holding)
Promoters
None
Held by 15 Schemes (17.56%)
Held by 87 FIIs (5.35%)
Bhanu Chopra (38.28%)
Nippon Life India Trustee Ltd-a/c Nippon India Sma (4.5%)
14.54%
Quarterly Results Snapshot (Consolidated) - Mar'26 - QoQ

QoQ Growth in quarter ended Mar 2026 is 32.50% vs 83.02% in Dec 2025

QoQ Growth in quarter ended Mar 2026 is 164.61% vs -48.15% in Dec 2025
Half Yearly Results Snapshot (Consolidated) - Sep'25
Growth in half year ended Sep 2025 is 5.71% vs 19.61% in Sep 2024
Growth in half year ended Sep 2025 is 0.37% vs 77.58% in Sep 2024
Nine Monthly Results Snapshot (Consolidated) - Dec'25
YoY Growth in nine months ended Dec 2025 is 35.79% vs 16.37% in Dec 2024
YoY Growth in nine months ended Dec 2025 is -19.29% vs 61.60% in Dec 2024
Annual Results Snapshot (Consolidated) - Mar'26
YoY Growth in year ended Mar 2026 is 69.37% vs 12.50% in Mar 2025
YoY Growth in year ended Mar 2026 is -6.96% vs 43.70% in Mar 2025
About Rategain Travel Technologies Ltd

Company Coordinates


