
Dashboard
With HIgh Debt (Debt-Equity Ratio at 7.45 times)- the company has a Weak Long Term Fundamental Strength
- Poor long term growth as Net Sales has grown by an annual rate of 12.16% and Operating profit at 0% over the last 5 years
- High Debt Company with a Debt to Equity ratio (avg) at 0 times
Negative results in Sep 25
77.19% of Promoter Shares are Pledged
Stock DNA
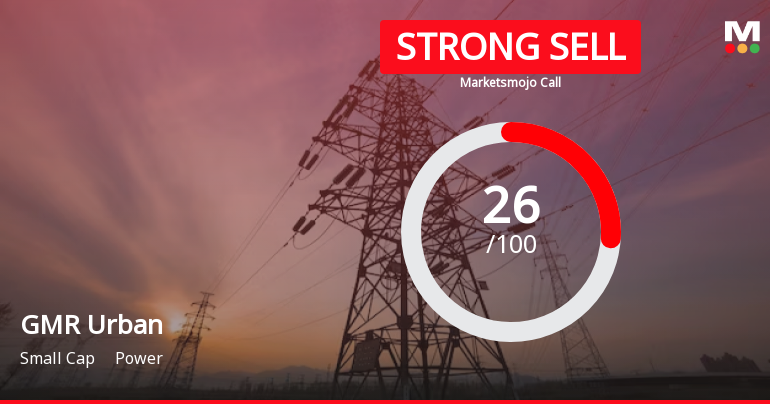
Power
INR 7,920 Cr (Small Cap)
NA (Loss Making)
21
0.00%
7.45
-31.78%
5.63
Total Returns (Price + Dividend) 
GMR Urban for the last several years.
Risk Adjusted Returns v/s
Returns Beta

News
GMR Power & Urban Infra: Analytical Revision Reflects Mixed Signals Across Key Financial and Technical Metrics
GMR Power & Urban Infra has undergone a revision in its evaluation metrics, reflecting a nuanced market assessment shaped by shifts in technical indicators, valuation considerations, financial trends, and overall quality parameters. This article analyses the factors influencing the recent changes in the company's market perception, providing investors with a comprehensive understanding of its current standing within the power sector.
Read More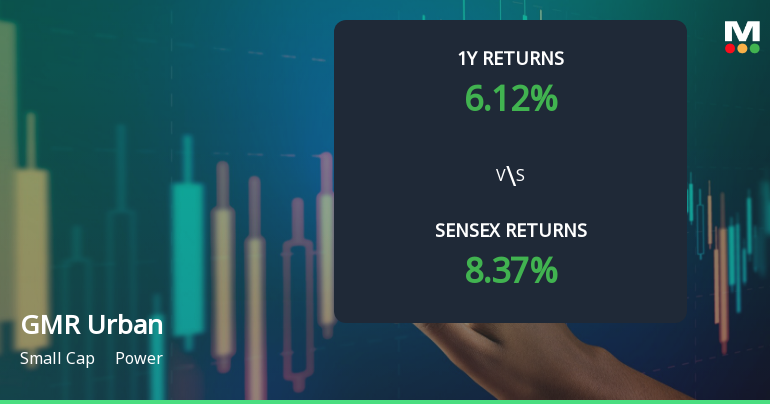
GMR Power & Urban Infra Sees Mixed Technical Signals Amid Sideways Momentum
GMR Power & Urban Infra is currently exhibiting a shift in price momentum, with technical indicators signalling a transition from a mildly bullish trend to a sideways movement. The stock's recent performance, combined with mixed signals from key technical tools such as MACD, RSI, and moving averages, suggests a nuanced market assessment for investors in the power sector.
Read More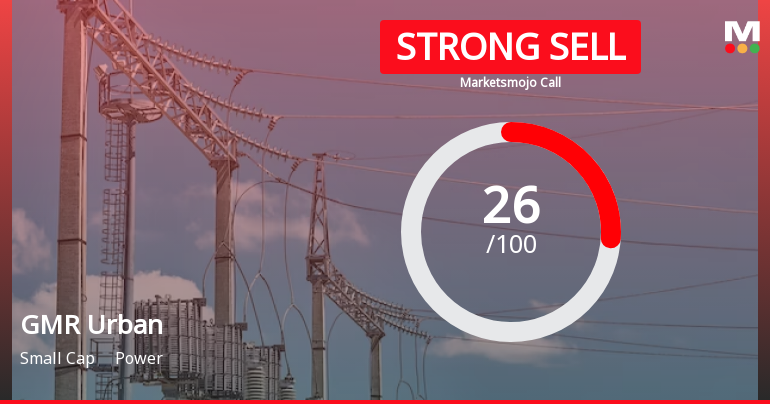
GMR Power & Urban Infra Ltd is Rated Strong Sell
GMR Power & Urban Infra Ltd is rated Strong Sell by MarketsMOJO, with this rating last updated on 26 December 2025. However, the analysis and financial metrics discussed here reflect the stock's current position as of 27 December 2025, providing investors with the most recent and relevant data to assess the company’s outlook.
Read More Announcements
Corporate Actions

No Upcoming Board Meetings

No Dividend history available

No Splits history available

No Bonus history available

No Rights history available
Quality key factors
Valuation key factors
Technicals key factors
 Technical Indicator Scale: Bearish, Mildly Bearish, Sideways, Mildly Bullish, Bullish Turned
 Shareholding Snapshot : Sep 2025
Shareholding Compare (%holding)
Promoters
77.194
Held by 5 Schemes (0.14%)
Held by 76 FIIs (3.89%)
Gmr Enterprises Private Limited (21.56%)
Synergy Industrials, Metals And Power Holdings Ltd (8.71%)
16.77%
Quarterly Results Snapshot (Consolidated) - Sep'25 - QoQ

QoQ Growth in quarter ended Sep 2025 is 9.82% vs -5.12% in Jun 2025
QoQ Growth in quarter ended Sep 2025 is 11,489.62% vs -117.84% in Jun 2025
Half Yearly Results Snapshot (Consolidated) - Sep'25

Growth in half year ended Sep 2025 is 15.47% vs 71.00% in Sep 2024
Growth in half year ended Sep 2025 is -40.51% vs 576.60% in Sep 2024
Nine Monthly Results Snapshot (Consolidated) - Dec'24
YoY Growth in nine months ended Dec 2024 is 61.38% vs -30.32% in Dec 2023
YoY Growth in nine months ended Dec 2024 is 618.01% vs -116.02% in Dec 2023
Annual Results Snapshot (Consolidated) - Mar'25
YoY Growth in year ended Mar 2025 is 41.34% vs -18.62% in Mar 2024
YoY Growth in year ended Mar 2025 is 1,475.84% vs -108.71% in Mar 2024
About GMR Power & Urban Infra Ltd

Company Coordinates


