
Compare Keystone Realtor with Similar Stocks
Dashboard
Weak Long Term Fundamental Strength with an average Return on Capital Employed (ROCE) of 4.62%
- Poor long term growth as Operating profit has grown by an annual rate 1.67% of over the last 5 years
- Low ability to service debt as the company has a high Debt to EBITDA ratio of 12.15 times
Flat results in Mar 26
Consistent Underperformance against the benchmark over the last 3 years
Total Returns (Price + Dividend) 
Latest dividend: 1.5 per share ex-dividend date: May-23-2025
Risk Adjusted Returns v/s
Returns Beta

News
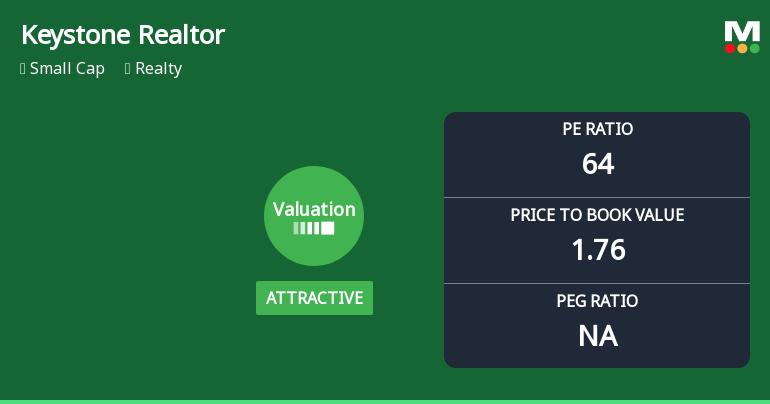
Keystone Realtors Ltd Valuation Shifts Signal Price Attractiveness Amid Market Challenges
Keystone Realtors Ltd has witnessed a notable shift in its valuation parameters, moving from a fair to an attractive rating despite ongoing market headwinds and subdued returns. This change reflects evolving investor sentiment and a reassessment of the company’s price multiples relative to its historical averages and peer group, offering a fresh perspective on its price attractiveness within the realty sector.
Read full news article
Keystone Realtors Ltd Technical Momentum Shifts Amid Mixed Market Signals
Keystone Realtors Ltd has experienced a nuanced shift in its technical momentum, reflecting a complex interplay of mildly bullish and bearish signals across multiple timeframes. Despite a recent uptick in price, the company’s overall technical outlook remains cautious, underscored by a downgrade to a Strong Sell rating and persistent challenges in long-term returns compared to the broader market.
Read full news article
Keystone Realtors Ltd Faces Bearish Momentum Amid Technical Downgrade
Keystone Realtors Ltd, a small-cap player in the realty sector, has seen its technical momentum shift decisively towards bearish territory, prompting a downgrade in its Mojo Grade to Strong Sell. Despite a marginal day change of 0.03%, the stock’s broader technical indicators and price performance reveal a deteriorating outlook, with key metrics signalling sustained weakness relative to benchmarks such as the Sensex.
Read full news article Announcements
Corporate Actions

No Upcoming Board Meetings

Keystone Realtors Ltd has declared 15% dividend, ex-date: 23 May 25

No Splits history available

No Bonus history available

No Rights history available
Quality key factors
Valuation key factors
Technicals key factors
 Technical Indicator Scale: Bearish, Mildly Bearish, Sideways, Mildly Bullish, Bullish Turned
 Shareholding Snapshot : Mar 2026
Shareholding Compare (%holding)
Promoters
None
Held by 4 Schemes (7.96%)
Held by 38 FIIs (2.55%)
Boman Rustom Irani (36.11%)
Quant Mutual Fund - Quant Small Cap Fund (4.93%)
4.42%
Quarterly Results Snapshot (Consolidated) - Mar'26 - QoQ

QoQ Growth in quarter ended Mar 2026 is 499.61% vs -46.69% in Dec 2025
QoQ Growth in quarter ended Mar 2026 is 1,450.89% vs -60.47% in Dec 2025
Half Yearly Results Snapshot (Consolidated) - Sep'25

Growth in half year ended Sep 2025 is -19.14% vs 7.33% in Sep 2024
Growth in half year ended Sep 2025 is -74.96% vs 79.48% in Sep 2024
Nine Monthly Results Snapshot (Consolidated) - Dec'25
YoY Growth in nine months ended Dec 2025 is -26.82% vs 0.61% in Dec 2024
YoY Growth in nine months ended Dec 2025 is -75.33% vs 31.44% in Dec 2024
Annual Results Snapshot (Consolidated) - Mar'26
YoY Growth in year ended Mar 2026 is 31.46% vs -9.82% in Mar 2025
YoY Growth in year ended Mar 2026 is -54.14% vs 53.25% in Mar 2025
About Keystone Realtors Ltd

Company Coordinates


