
Compare Supreme Power with Similar Stocks
Dashboard
High Management Efficiency with a high ROCE of 20.16%
Strong ability to service debt as the company has a low Debt to EBITDA ratio of 1.60 times
Healthy long term growth as Net Sales has grown by an annual rate of 40.00% and Operating profit at 61.86%
Flat results in Dec 25
With ROCE of 17.5, it has a Expensive valuation with a 4.2 Enterprise value to Capital Employed
Below par performance in long term as well as near term
Stock DNA
Other Electrical Equipment
INR 617 Cr (Micro Cap)
38.00
61
0.00%
0.30
17.29%
5.15
Total Returns (Price + Dividend) 
Supreme Power for the last several years.
Risk Adjusted Returns v/s
Returns Beta

News
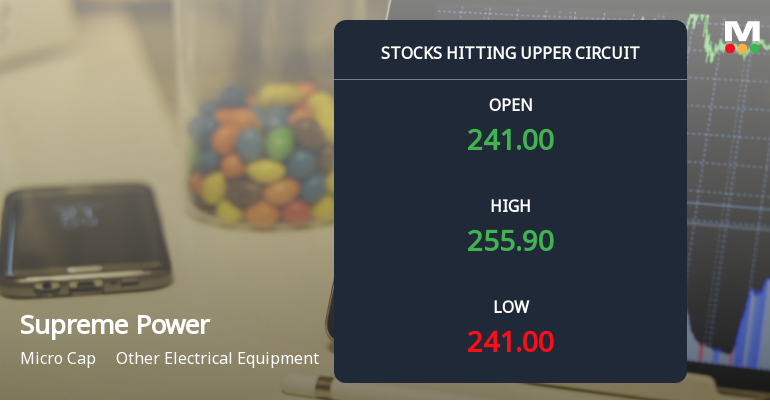
Supreme Power Equipment Ltd Locks at Upper Circuit With 4.98% Gain — Buyers Queue, Sellers Absent
At Rs 255.90, the buying was done — not because demand dried up, but because the exchange wouldn't let the stock go any higher. Supreme Power Equipment Ltd locked at its upper circuit of 4.98% on 22 Jun 2026, with buyers queuing and no sellers willing to part with shares.
Read full news article
Supreme Power Equipment Ltd is Rated Hold
Supreme Power Equipment Ltd is rated 'Hold' by MarketsMOJO, a rating that was last updated on 08 April 2026. While the rating change occurred on that date, the analysis and financial metrics discussed here reflect the stock's current position as of 20 June 2026, providing investors with the most up-to-date view of the company’s performance and outlook.
Read full news article
Supreme Power Equipment Ltd Locks at Upper Circuit With 3.14% Gain — Buyers Queue, Sellers Absent
At Rs 250.4, the buying was done — not because demand dried up, but because the exchange wouldn't let the stock go any higher. Supreme Power Equipment Ltd locked at its upper circuit of 5% on 15 Jun 2026, with buyers queuing and no sellers willing to part with shares.
Read full news article Announcements
Corporate Actions

No Upcoming Board Meetings

No Dividend history available

No Splits history available

No Bonus history available

No Rights history available
Quality key factors
Valuation key factors
Technicals key factors
 Technical Indicator Scale: Bearish, Mildly Bearish, Sideways, Mildly Bullish, Bullish Turned
 Shareholding Snapshot : Mar 2026
Shareholding Compare (%holding)
Promoters
None
Held by 0 Schemes
Held by 3 FIIs (0.58%)
Vee Rajmohan (31.51%)
Namburikandasamyraja Beemaraja Karthik (2.8%)
36.4%
Quarterly Results Snapshot (Consolidated) - Dec'25 - QoQ

QoQ Growth in quarter ended Dec 2025 is -10.72% vs 14.43% in Sep 2025
QoQ Growth in quarter ended Dec 2025 is -31.85% vs 11.46% in Sep 2025
Half Yearly Results Snapshot (Consolidated) - Mar'26

Growth in half year ended Mar 2026 is 41.57% vs -16.97% in Sep 2025
Growth in half year ended Mar 2026 is 17.22% vs -17.96% in Sep 2025
Nine Monthly Results Snapshot (Consolidated) - Dec'25
YoY Growth in nine months ended Dec 2025 is 27.21% vs -1.29% in Dec 2024
YoY Growth in nine months ended Dec 2025 is 24.17% vs 4.57% in Dec 2024
Annual Results Snapshot (Consolidated) - Mar'26
YoY Growth in year ended Mar 2026 is 22.14% vs 31.08% in Mar 2025
YoY Growth in year ended Mar 2026 is 9.89% vs 32.86% in Mar 2025
About Supreme Power Equipment Ltd

Company Coordinates


