


Key Events This Week
1 June: Stock hits lower circuit at ₹234.55 amid heavy selling
2 June: Another lower circuit hit at ₹240.00 despite sector outperformance
3 June: Surges to upper circuit at ₹258.55 on robust buying pressure
4-5 June: Price retreats, closing the week at ₹245.20 (-0.67%)
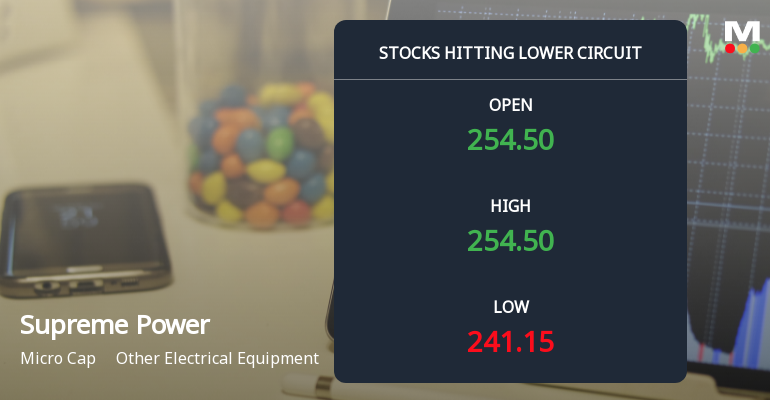
Below All Moving Averages and Now at Lower Circuit: Supreme Power Equipment Ltd Loses 4.98% in a Single Session
2026-06-10 10:00:24At Rs 241.15, sellers were still queuing — but there were no buyers willing to take the other side. Supreme Power Equipment Ltd locked at its lower circuit of 5% on 10 Jun 2026, with unfilled sell orders and a frozen price, signalling persistent selling pressure in a micro-cap stock.
Read full news article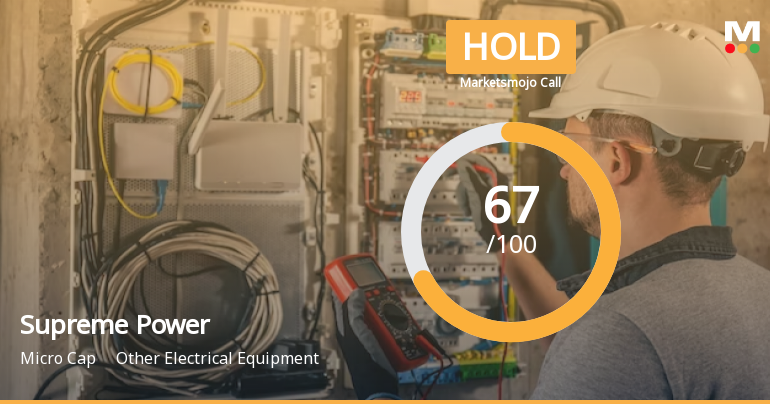
Supreme Power Equipment Ltd is Rated Hold
2026-06-09 10:10:03Supreme Power Equipment Ltd is rated 'Hold' by MarketsMOJO, with this rating last updated on 08 April 2026. However, the analysis and financial metrics discussed here reflect the stock's current position as of 09 June 2026, providing investors with an up-to-date perspective on the company’s standing.
Read full news article
Supreme Power Equipment Ltd Locks at Upper Circuit With 5% Gain — Buyers Queue, Sellers Absent
2026-06-03 10:00:51At Rs 258.55, the buying was done — not because demand dried up, but because the exchange wouldn't let the stock go any higher. Supreme Power Equipment Ltd locked at its upper circuit of 5% on 3 Jun 2026, with buyers queuing and no sellers willing to part with shares.
Read full news article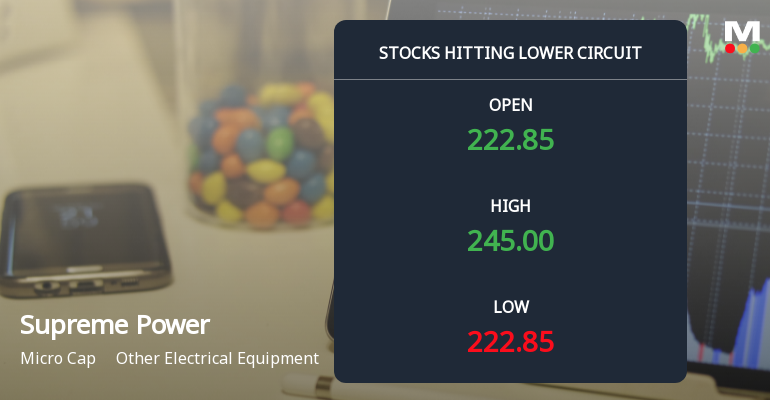
Below All Moving Averages and Now at Lower Circuit: Supreme Power Equipment Ltd Loses 5.45% in a Single Session
2026-06-02 10:00:43At Rs 222.85, sellers were still queuing — but there were no buyers willing to take the other side. Supreme Power Equipment Ltd locked at its lower circuit of 5.45% on 2 Jun 2026, with unfilled sell orders and a frozen price, signalling persistent selling pressure in a micro-cap stock.
Read full news article
Below All Moving Averages and Now at Lower Circuit: Supreme Power Equipment Ltd Loses 4.98% in a Single Session
2026-06-01 10:00:42At Rs 234.55, sellers were still queuing — but there were no buyers willing to take the other side. Supreme Power Equipment Ltd locked at its lower circuit of 5% on 1 Jun 2026, with unfilled sell orders and a frozen price, signalling persistent selling pressure in a micro-cap stock.
Read full news article


