
Compare Bluestone Jewel with Similar Stocks
Dashboard
Weak Long Term Fundamental Strength with an average Return on Capital Employed (ROCE) of 0%
- Low ability to service debt as the company has a high Debt to EBITDA ratio of 4.97 times
With ROCE of 5.8, it has a Expensive valuation with a 2.8 Enterprise value to Capital Employed
98.8% of Promoter Shares are Pledged
Stock DNA
Gems, Jewellery And Watches
INR 7,716 Cr (Small Cap)
517.00
54
0.00%
0.78
1.43%
4.23
Total Returns (Price + Dividend) 
Bluestone Jewel for the last several years.
Risk Adjusted Returns v/s
Returns Beta

News
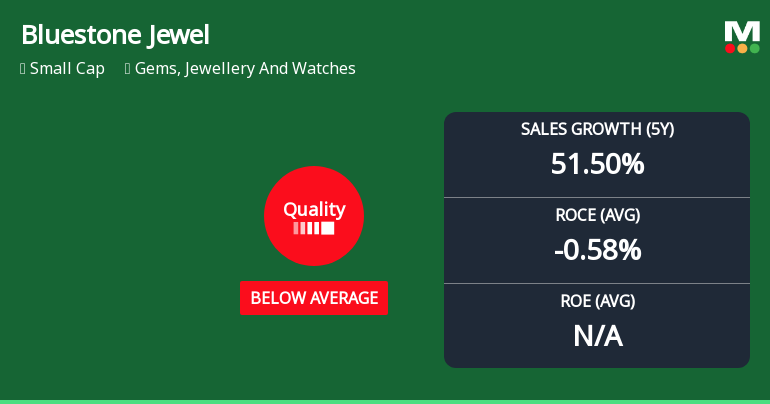
Bluestone Jewellery & Lifestyle Ltd Downgraded as Quality Parameters Deteriorate
Bluestone Jewellery & Lifestyle Ltd has recently seen its quality grade downgraded from 'Hold' to 'Sell' by MarketsMOJO, reflecting a shift from average to below average in key business fundamentals. This article analyses the underlying factors behind this downgrade, focusing on profitability metrics, debt levels, and operational consistency, while comparing the company’s performance with industry peers and broader market benchmarks.
Read full news article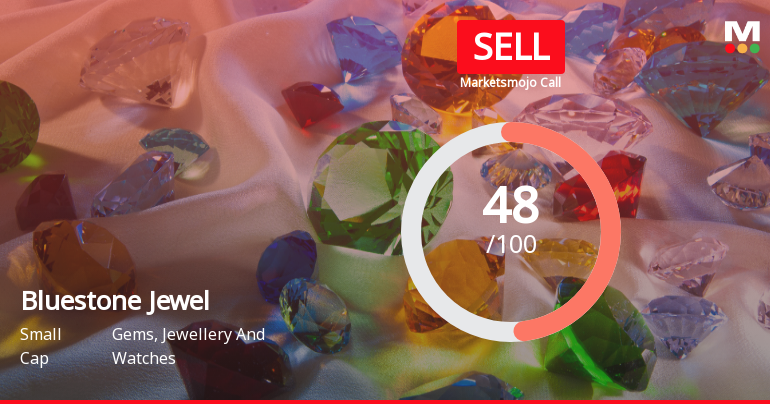
Bluestone Jewellery & Lifestyle Ltd Downgraded to Sell Amid Valuation and Technical Concerns
Bluestone Jewellery & Lifestyle Ltd has seen its investment rating downgraded from Hold to Sell, reflecting a combination of deteriorating technical indicators, expensive valuation metrics, and mixed financial trends. Despite strong sales growth and recent positive quarterly results, concerns over management efficiency, debt servicing ability, and bearish technical signals have weighed heavily on the stock’s outlook.
Read full news article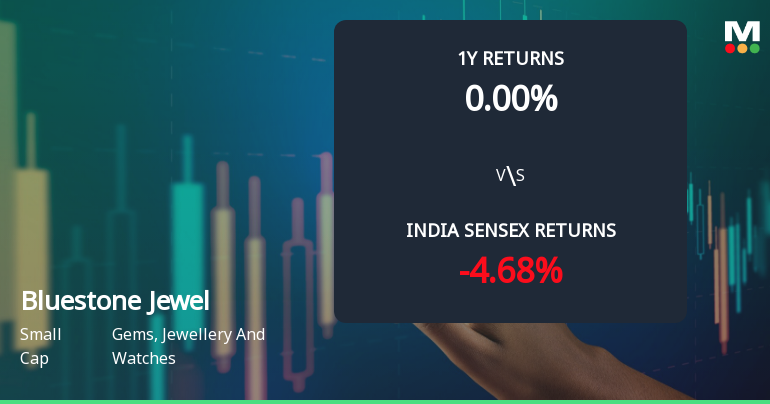
Bluestone Jewellery & Lifestyle Ltd Faces Mildly Bearish Technical Shift Amid Mixed Momentum
Bluestone Jewellery & Lifestyle Ltd has experienced a notable shift in its technical momentum, transitioning from a sideways trend to a mildly bearish stance. Despite a recent downgrade from Hold to Sell by MarketsMOJO, the stock’s mixed technical indicators suggest a nuanced outlook for investors navigating the gems and jewellery sector.
Read full news article Announcements
Corporate Actions

No Upcoming Board Meetings

No Dividend history available

No Splits history available

No Bonus history available

No Rights history available
Quality key factors
Valuation key factors
Technicals key factors
 Technical Indicator Scale: Bearish, Mildly Bearish, Sideways, Mildly Bullish, Bullish Turned
 Shareholding Snapshot : Mar 2026
Shareholding Compare (%holding)
FIIs
98.8012
Held by 9 Schemes (6.11%)
Held by 40 FIIs (34.19%)
Gaurav Singh Kushwaha (16.07%)
Accel India Iii (mauritius) Ltd (8.73%)
12.64%
Quarterly Results Snapshot (Standalone) - Mar'26 - QoQ

QoQ Growth in quarter ended Mar 2026 is -8.05% vs 45.76% in Dec 2025
QoQ Growth in quarter ended Mar 2026 is -49.01% vs 245.51% in Dec 2025
Half Yearly Results Snapshot (Standalone) - Sep'25
Not Applicable: The company has declared_date for only one period
Not Applicable: The company has declared_date for only one period
Nine Monthly Results Snapshot (Standalone) - Dec'25
Not Applicable: The company has declared_date for only one period
Not Applicable: The company has declared_date for only one period
Annual Results Snapshot (Standalone) - Mar'26
YoY Growth in year ended Mar 2026 is 37.92% vs 39.83% in Mar 2025

YoY Growth in year ended Mar 2026 is 111.86% vs -54.11% in Mar 2025
About Bluestone Jewellery & Lifestyle Ltd

Company Coordinates


