
Compare PC Jeweller with Similar Stocks
Dashboard
Weak Long Term Fundamental Strength with an average Return on Capital Employed (ROCE) of 2.92%
- Poor long term growth as Net Sales has grown by an annual rate of 3.48% and Operating profit at 11.49% over the last 5 years
- Low ability to service debt as the company has a high Debt to EBITDA ratio of 1.74 times
Falling Participation by Institutional Investors
Underperformed the market in the last 1 year
Stock DNA
Gems, Jewellery And Watches
INR 8,856 Cr (Small Cap)
12.00
NA
0.00%
0.13
8.75%
1.08
Total Returns (Price + Dividend) 
Latest dividend: 0.05 per share ex-dividend date: Sep-19-2018
Risk Adjusted Returns v/s
Returns Beta

News

PC Jeweller Ltd Sees Exceptional Volume Amid Mixed Technical Signals
PC Jeweller Ltd, a small-cap player in the Gems, Jewellery and Watches sector, witnessed one of the highest trading volumes on 31 July 2026, with over 2.78 crore shares changing hands. Despite this surge in activity, the stock closed marginally lower, reflecting a complex interplay of market forces and investor sentiment.
Read full news article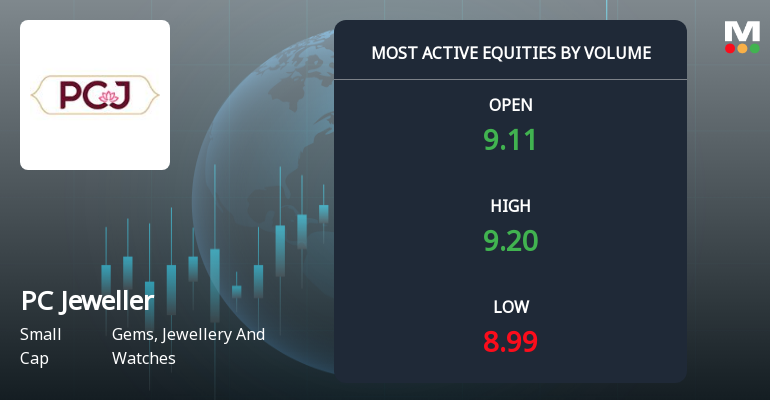
PC Jeweller Ltd Sees Exceptional Volume Amid Continued Downtrend
PC Jeweller Ltd (PCJEWELLER), a small-cap player in the Gems, Jewellery and Watches sector, witnessed one of the highest trading volumes on 30 Jul 2026, with over 2.31 crore shares changing hands. Despite this surge in activity, the stock continued its downward trajectory, reflecting persistent selling pressure and a recent downgrade to a Sell rating by MarketsMOJO.
Read full news article
PC Jeweller Ltd Sees Exceptional Volume Amid Mixed Technical Signals
PC Jeweller Ltd, a small-cap player in the Gems, Jewellery and Watches sector, witnessed one of the highest trading volumes on 29 Jul 2026, with over 2.23 crore shares changing hands. Despite this surge in activity, the stock edged down marginally by 0.33%, reflecting a complex interplay of investor sentiment amid a recent downgrade to a Sell rating by MarketsMOJO.
Read full news article Announcements
PC Jeweller Limited - Other General Purpose
09-Dec-2019 | Source : NSEPC Jeweller Limited has informed the Exchange regarding Related Party transactions on a consolidated basis for the half year ended September 30, 2019
PC Jeweller Limited - Updates
18-Nov-2019 | Source : NSEPC Jeweller Limited has informed the Exchange regarding 'Newspaper Advertisements'.
PC Jeweller Limited - Updates
15-Nov-2019 | Source : NSEPC Jeweller Limited has informed the Exchange regarding 'Management Presentation'.
Corporate Actions

No Upcoming Board Meetings

PC Jeweller Ltd has declared 5% dividend, ex-date: 19 Sep 18

PC Jeweller Ltd has announced 1:10 stock split, ex-date: 16 Dec 24

PC Jeweller Ltd has announced 1:1 bonus issue, ex-date: 06 Jul 17

No Rights history available
Quality key factors
Valuation key factors
Technicals key factors
 Technical Indicator Scale: Bearish, Mildly Bearish, Sideways, Mildly Bullish, Bullish Turned
 Shareholding Snapshot : Jun 2026
Shareholding Compare (%holding)
Non Institution
None
Held by 5 Schemes (0.1%)
Held by 86 FIIs (12.15%)
Balram Garg (21.04%)
Ebisu Global Opportunities Fund Limited (0%)
31.05%
Quarterly Results Snapshot (Consolidated) - Mar'26 - QoQ

QoQ Growth in quarter ended Mar 2026 is 5.94% vs 6.07% in Dec 2025
QoQ Growth in quarter ended Mar 2026 is -19.57% vs -9.28% in Dec 2025
Half Yearly Results Snapshot (Consolidated) - Sep'25
Growth in half year ended Sep 2025 is 71.08% vs 75.32% in Sep 2024
Growth in half year ended Sep 2025 is 10.91% vs 208.13% in Sep 2024
Nine Monthly Results Snapshot (Consolidated) - Dec'25
YoY Growth in nine months ended Dec 2025 is 56.93% vs 177.53% in Dec 2024
YoY Growth in nine months ended Dec 2025 is 16.29% vs 195.11% in Dec 2024
Annual Results Snapshot (Consolidated) - Mar'26
YoY Growth in year ended Mar 2026 is 49.38% vs 270.76% in Mar 2025
YoY Growth in year ended Mar 2026 is 23.67% vs 191.79% in Mar 2025
About PC Jeweller Ltd

Company Coordinates


