
Compare Kalyan Jewellers with Similar Stocks
Dashboard
Healthy long term growth as Net Sales has grown by an annual rate of 33.05% and Operating profit at 39.43%
With a growth in Net Sales of 29.86%, the company declared Very Positive results in Mar 26
High Institutional Holdings at 26.65%
Consistent Returns over the last 3 years
With its market cap of Rs 65,517 cr, it is the second biggest company in the sector (behind Titan Company)and constitutes 11.18% of the entire sector
Stock DNA
Gems, Jewellery And Watches
INR 63,601 Cr (Mid Cap)
47.00
55
0.24%
0.83
21.89%
10.39
Total Returns (Price + Dividend) 
Latest dividend: 1.5 per share ex-dividend date: Sep-04-2025
Risk Adjusted Returns v/s
Returns Beta

News

Kalyan Jewellers India Ltd Sees Robust Trading Activity Amid Slight Price Dip
Kalyan Jewellers India Ltd, a prominent player in the Gems, Jewellery and Watches sector, witnessed significant trading activity on 31 July 2026, with a total traded value exceeding ₹255 crore. Despite a marginal dip of 0.54% in its share price, the stock remains close to its 52-week high, reflecting sustained investor interest and robust institutional participation.
Read full news article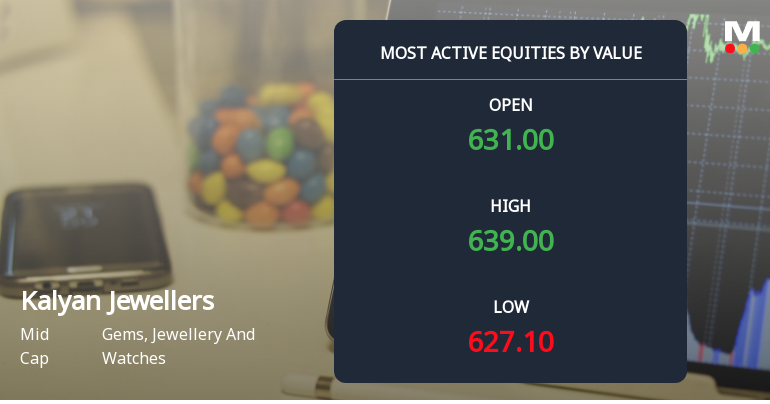
Kalyan Jewellers India Ltd Sees Robust Trading Activity Amid Upgraded Mojo Grade
Kalyan Jewellers India Ltd (KALYANKJIL) has emerged as one of the most actively traded stocks by value on 30 July 2026, reflecting strong investor interest and institutional participation. The mid-cap company, operating in the Gems, Jewellery and Watches sector, recorded a total traded volume of 63.86 lakh shares with a turnover exceeding ₹403.7 crores, marking a significant surge in market activity following an upgrade in its Mojo Grade from Hold to Buy on 13 July 2026.
Read full news article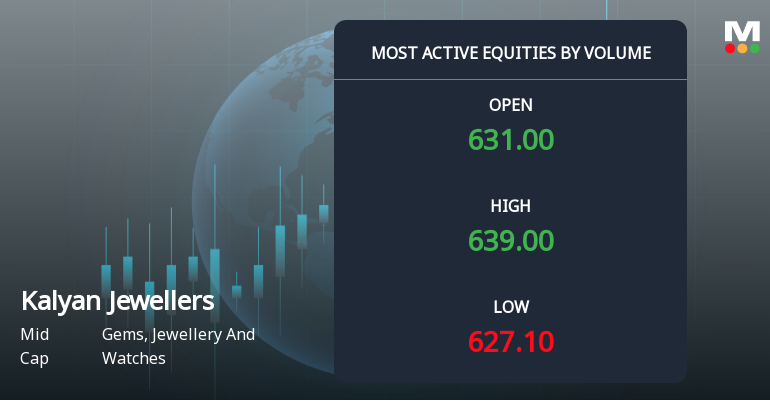
Kalyan Jewellers India Ltd Sees Exceptional Volume Surge Amidst Strong Price Momentum
Kalyan Jewellers India Ltd (KALYANKJIL) has emerged as one of the most actively traded stocks by volume on 30 July 2026, registering a remarkable surge in investor participation and setting a new 52-week high. The mid-cap jewellery company’s shares have demonstrated robust momentum, supported by strong fundamentals and positive technical signals, positioning it favourably within the Gems, Jewellery and Watches sector.
Read full news article Announcements
Corporate Actions

04 Aug 2026

Kalyan Jewellers India Ltd has declared 15% dividend, ex-date: 04 Sep 25

No Splits history available

No Bonus history available

No Rights history available
Quality key factors
Valuation key factors
Technicals key factors
 Technical Indicator Scale: Bearish, Mildly Bearish, Sideways, Mildly Bullish, Bullish Turned
 Shareholding Snapshot : Jun 2026
Shareholding Compare (%holding)
Promoters
24.8497
Held by 31 Schemes (15.41%)
Held by 242 FIIs (10.82%)
Kalyanaraman T S (22.37%)
Motilal Oswal Midcap Fund (9.38%)
8.97%
Quarterly Results Snapshot (Consolidated) - Mar'26 - QoQ

QoQ Growth in quarter ended Mar 2026 is -0.66% vs 31.66% in Dec 2025
QoQ Growth in quarter ended Mar 2026 is -1.63% vs 59.80% in Dec 2025
Half Yearly Results Snapshot (Consolidated) - Sep'25
Growth in half year ended Sep 2025 is 30.37% vs 31.97% in Sep 2024

Growth in half year ended Sep 2025 is 70.12% vs 10.47% in Sep 2024
Nine Monthly Results Snapshot (Consolidated) - Dec'25
YoY Growth in nine months ended Dec 2025 is 34.90% vs 34.72% in Dec 2024
YoY Growth in nine months ended Dec 2025 is 78.47% vs 14.67% in Dec 2024
Annual Results Snapshot (Consolidated) - Mar'26
YoY Growth in year ended Mar 2026 is 42.71% vs 35.27% in Mar 2025
YoY Growth in year ended Mar 2026 is 88.92% vs 19.66% in Mar 2025
About Kalyan Jewellers India Ltd

Company Coordinates


