
Compare Orkla India with Similar Stocks
Total Returns (Price + Dividend) 
Orkla India for the last several years.
Risk Adjusted Returns v/s
Returns Beta

News
Orkla India Ltd Upgraded to Hold by MarketsMOJO on Improved Fundamentals
Orkla India Ltd has been upgraded to a Hold rating with a Mojo Score of 55.0, reflecting a significant improvement in its quality metrics and valuation appeal. The upgrade, effective from 20 May 2026, follows a detailed reassessment of the company’s financial health, valuation, and technical indicators amid a flat quarterly performance and a net-debt free balance sheet.
Read full news article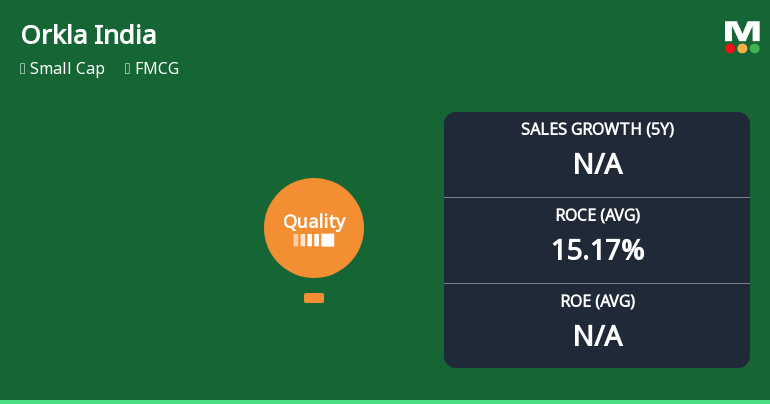
Orkla India Ltd Quality Grade Upgrade Reflects Improved Business Fundamentals
Orkla India Ltd has recently seen its quality grade upgraded from "Does Not Qualify" to "Good," reflecting notable improvements in its business fundamentals. This development comes amid steady operational metrics, low leverage, and consistent returns, positioning the FMCG small-cap favourably within its sector despite a Hold mojo grade and modest market cap.
Read full news article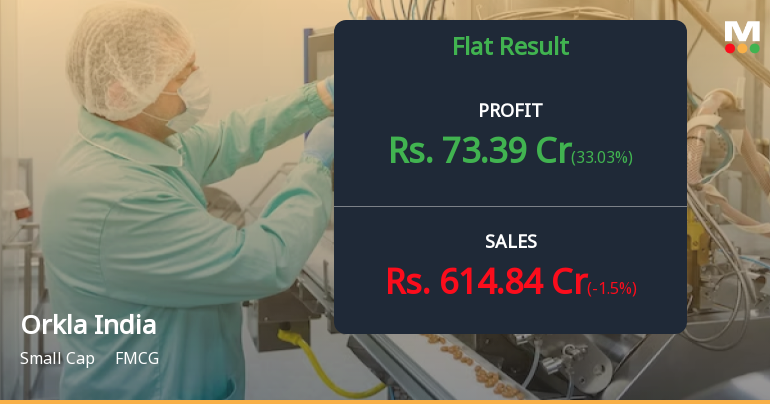
Orkla India Q4 FY26: Strong Profit Rebound Masks Underlying Growth Concerns
Orkla India Limited, the FMCG company formerly known as MTR Foods, delivered a mixed performance in Q4 FY26 (January-March 2026), posting a consolidated net profit of ₹73.43 crores—a robust 108.37% surge year-on-year but reflecting a sequential decline from the previous quarter. With a market capitalisation of ₹8,532 crores and shares trading at ₹639.00 (up 2.26% on May 20, 2026), the stock has gained modest traction following the results announcement, though investors remain cautious about the company's stagnant revenue trajectory and compressed margins.
Read full news article Announcements
Corporate Actions

No Upcoming Board Meetings

No Dividend history available

No Splits history available

No Bonus history available

No Rights history available
Quality key factors
Valuation key factors
Technicals key factors
 Technical Indicator Scale: Bearish, Mildly Bearish, Sideways, Mildly Bullish, Bullish Turned
 Shareholding Snapshot : Mar 2026
Shareholding Compare (%holding)
Promoters
None
Held by 13 Schemes (8.45%)
Held by 27 FIIs (2.42%)
Orkla Asia Pacific Pte Ltd (75.0%)
Nippon Life India Trustee Ltd-a/c Nippon India Con (6.12%)
13.0%
Quarterly Results Snapshot (Standalone) - Mar'26 - QoQ

QoQ Growth in quarter ended Mar 2026 is -1.50% vs -2.16% in Dec 2025
QoQ Growth in quarter ended Mar 2026 is 33.03% vs -26.99% in Dec 2025
Half Yearly Results Snapshot (Standalone) - Sep'25
Not Applicable: The company has declared_date for only one period
Not Applicable: The company has declared_date for only one period
Nine Monthly Results Snapshot (Standalone) - Dec'25
Not Applicable: The company has declared_date for only one period
Not Applicable: The company has declared_date for only one period
Annual Results Snapshot (Standalone) - Mar'26
Not Applicable: The company has declared_date for only one period
Not Applicable: The company has declared_date for only one period
About Orkla India Ltd

Company Coordinates


