Hindustan Media

  • Market Cap: Micro Cap
  • Industry: Media & Entertainment
  • ISIN: INE871K01015
  • NSEID: HMVL
  • BSEID: 533217
INR
70.07
1.63 (2.38%)
BSENSE

Jan 28

BSE+NSE Vol: 16.82 k

  • Price Points
  • Score
  • Mojo Parameters
  • Total Return
  • News and Corporate Actions
  • Key factors
  • Shareholding
  • Financials
  • CompanyCV
stock-summaryPrice Point
High/Low

1Day

52 Week

Valuation
Technical
Day's Volume

CASH

16.82 k (39.07%) Volume

Shareholding (Dec 2025)

FII

0.11%

Held by 5 FIIs

DII

0.07%

Held by 0 DIIs

Promoter

74.40%

Is Hindustan Media overvalued or undervalued?

09-Jun-2025

As of October 27, 2020, Hindustan Media is considered overvalued with a valuation grade shift to risky, reflected in its low PE ratio of 8.52 and financial challenges, despite a recent stock return of 13.13% outperforming the Sensex.

As of 27 October 2020, the valuation grade for Hindustan Media has moved from very attractive to risky, indicating a significant shift in its perceived value. The company is currently considered overvalued. Key ratios include a PE Ratio of 8.52, an EV to EBIT of 5.16, and a Price to Book Value of 0.43, which suggest that the stock may not be adequately priced given its financial performance.<BR><BR>In comparison to its peers, Hindustan Media's PE Ratio is notably lower than D B Corp's 12.8 and Jagran Prakashan's 12.15, both of which are rated more favorably. Additionally, the company's negative capital employed and low ROE of 5.07% further highlight its financial challenges. Despite a recent one-month stock return of 13.13%, which outperformed the Sensex's 3.85%, the overall valuation metrics suggest that Hindustan Media is not positioned favorably in the market.

View full answer

Who are in the management team of Hindustan Media?

06-Jun-2025

As of March 2022, the management team of Hindustan Media includes Chairperson Shobhana Bhartia, Managing Director Praveen Someshwar, and several independent directors, along with company secretaries for compliance.

As of March 2022, the management team of Hindustan Media includes the following individuals:<BR><BR>1. Shobhana Bhartia - Chairperson<BR>2. Ashwani Windlass - Independent Director<BR>3. Priyavrat Bhartia - Director<BR>4. Mukesh Aghi - Independent Director<BR>5. Praveen Someshwar - Managing Director<BR>6. Savitri Kunadi - Independent Director<BR>7. Sameer Singh - Independent Director<BR>8. Shamit Bhartia - Director<BR>9. Pumit Kumar Chellaramani - Company Secretary & Compliance Officer<BR>10. Sharad Bhansali - Independent Director<BR>11. Nikhil Sethi - Company Secretary & Compliance Officer<BR><BR>This team comprises a mix of directors and independent directors, along with company secretaries responsible for compliance.

View full answer

What does Hindustan Media do?

06-Jun-2025

Hindustan Media Ventures Ltd operates in the Media & Entertainment industry, focusing on publishing and related services. As of March 2025, it reported net sales of ₹201 Cr and a net profit of ₹45 Cr, with a market cap of ₹670 Cr.

Overview:<BR>Hindustan Media Ventures Ltd operates in the Media & Entertainment industry and is categorized as a Micro Cap company.<BR><BR>History:<BR>The company was incorporated in 1918 as The Behar Journals Ltd and underwent several name changes, becoming Hindustan Media Ventures Ltd in November 2008. The latest quarterly results reported net sales and profit for the period ending March 2025.<BR><BR>Financial Snapshot:<BR>- Net Sales: 201 Cr (Quarterly Results - Mar 2025)<BR>- Net Profit: 45 Cr (Quarterly Results - Mar 2025)<BR>- Market Cap: Rs 670 Cr (Micro Cap)<BR><BR>Key Metrics:<BR>- P/E: 9.00<BR>- Industry P/E: 16<BR>- Dividend Yield: 0.00%<BR>- Debt Equity: -0.61<BR>- Return on Equity: 5.07%<BR>- Price to Book: 0.43<BR><BR>Contact Details:<BR>Address: Budh Marg, Patna Bihar: 800001<BR>Tel: 91-0612-2223434<BR>Email: hmvlinvestor@livehindustan.com<BR>Website: http://www.hmvl.in

View full answer

Has Hindustan Media declared dividend?

06-Jun-2025

Hindustan Media Ventures Ltd has declared a 12% dividend, amounting to ₹1.2 per share, but the dividend yield is 0%. While the company has shown strong total returns over longer periods, recent performance indicates no contribution from dividends.

Hindustan Media Ventures Ltd has declared a 12% dividend.<BR><BR>Dividend Details:<BR>- Percentage announced: 12%<BR>- Amount per share: 1.2<BR>- Ex-date: 09 Sep 19<BR><BR>Dividend Yield: 0%<BR><BR>Total Returns by Period:<BR>In the 6-month period, the price return was -2.59%, the dividend return was 0%, resulting in a total return of -2.59%.<BR><BR>For the 1-year period, the price return was -3.7%, the dividend return was 0%, leading to a total return of -3.7%.<BR><BR>Over the 2-year period, the price return was 40.06%, the dividend return was 0%, which resulted in a total return of 40.06%.<BR><BR>In the 3-year period, the price return was 58.88%, the dividend return was 0%, culminating in a total return of 58.88%.<BR><BR>For the 4-year period, the price return was 1.64%, the dividend return was 0%, resulting in a total return of 1.64%.<BR><BR>In the 5-year period, the price return was 93.71%, the dividend return was 0%, leading to a total return of 93.71%.<BR><BR>Overall, while Hindustan Media has declared a dividend, the dividend yield remains at 0%, indicating that the dividend has not contributed to returns in recent periods. The total returns show significant variability, with strong performance over longer periods, particularly in the 2 to 5-year spans.

View full answer

Who are the peers of the Hindustan Media?

03-Jun-2025

Hindustan Media's peers include Sun TV Network, Zee Entertainment, Nazara Technologies, Saregama India, PVR Inox, OnMobile Global, Madhuveer Com, Vashu Bhagnani, H T Media, and Music Broadcast. Management risk varies from excellent to below average among peers, with Madhuveer Com showing the highest 1-year return at 130.45%, while Hindustan Media's return is -3.69%.

Peers: The peers of Hindustan Media are Sun TV Network, Zee Entertainmen, Nazara Technolo., Saregama India, PVR Inox, OnMobile Global, Madhuveer Com, Vashu Bhagnani, H T Media, and Music Broadcast.<BR><BR>Quality Snapshot: Excellent management risk is observed at Sun TV Network, Saregama India, and Nazara Technolo., while Average management risk is found at Zee Entertainmen, PVR Inox, and OnMobile Global. Below Average management risk is present at Hindustan Media, Madhuveer Com, Vashu Bhagnani, H T Media, and Music Broadcast. Growth is rated as Good for Saregama India and Nazara Technolo., while Below Average growth is noted for Sun TV Network, Zee Entertainmen, PVR Inox, Hindustan Media, OnMobile Global, Madhuveer Com, Vashu Bhagnani, H T Media, and Music Broadcast. All peers exhibit Excellent capital structure except for PVR Inox and Vashu Bhagnani, which have Below Average and Average ratings, respectively.<BR><BR>Return Snapshot: The peer with the highest 1-year return is Madhuveer Com at 130.45%, while Vashu Bhagnani has the lowest at -63.50%. Hindustan Media's 1-year return is -3.69%, which is higher than Vashu Bhagnani's but lower than Madhuveer Com's. Additionally, the six-month return is negative for PVR Inox, OnMobile Global, and Vashu Bhagnani.

View full answer

Who are the top shareholders of the Hindustan Media?

17-Jul-2025

The top shareholders of Hindustan Media are Ht Media Limited, holding 74.4%, and Mathew Cyriac, the largest public shareholder with 6.3%. Individual investors own 20.56%, while foreign institutional investors hold 0.16%, and no mutual funds have shares in the company.

The top shareholders of Hindustan Media include Ht Media Limited, which holds a significant 74.4% of the shares, making it the largest promoter. The highest public shareholder is Mathew Cyriac, with a holding of 6.3%. Additionally, individual investors collectively hold 20.56% of the shares, while foreign institutional investors (FIIs) have a minor stake of 0.16% through seven different FIIs. There are no mutual funds currently holding shares in the company.

View full answer

How big is Hindustan Media?

24-Jul-2025

As of 24th July, Hindustan Media Ventures Ltd has a market capitalization of 655.00 Cr, with recent net sales of 732.89 Cr and a net profit of 77.78 Cr. The company's shareholder's funds are 1,479.07 Cr, and total assets amount to 2,217.66 Cr.

As of 24th July, Hindustan Media Ventures Ltd has a market capitalization of 655.00 Cr, classified as a Micro Cap.<BR><BR>In the latest four quarters, the company reported Net Sales of 732.89 Cr and a Net Profit of 77.78 Cr.<BR><BR>The latest annual period for the balance sheet is March 2024, showing Shareholder's Funds of 1,479.07 Cr and Total Assets of 2,217.66 Cr.

View full answer

Is Hindustan Media technically bullish or bearish?

03-Nov-2025

As of October 31, 2025, Hindustan Media's technical trend has shifted to a moderate bearish stance, indicated by bearish MACD, Bollinger Bands, and moving averages, despite a mildly bullish OBV on the monthly timeframe.

As of 31 October 2025, the technical trend for Hindustan Media has changed from mildly bearish to bearish. The current stance is bearish with a moderate strength. Key indicators driving this include a bearish MACD on the weekly chart, bearish signals from Bollinger Bands on both weekly and monthly time frames, and a bearish daily moving average. The KST is also bearish on both weekly and monthly charts. While the OBV shows a mildly bullish signal on the monthly timeframe, it does not outweigh the overall bearish indicators. The stock has underperformed against the Sensex in multiple time frames, further supporting the bearish outlook.

View full answer

When is the next results date for Hindustan Media?

04-Nov-2025

The next results date for Hindustan Media is 10 November 2025.

The next results date for Hindustan Media is scheduled for 10 November 2025.

View full answer

How has been the historical performance of Hindustan Media?

12-Nov-2025

Hindustan Media's historical performance shows a recovery in 2025, with net sales increasing to INR 732.89 crore and significant improvements in operating profit and profit after tax, reaching INR 107.77 crore and INR 77.78 crore, respectively. Total assets rose to INR 2,258.39 crore, indicating a stable financial position.

Answer:<BR>The historical performance of Hindustan Media shows a fluctuating trend in key financial metrics over the years.<BR><BR>Breakdown:<BR>Hindustan Media's net sales have shown a slight increase from INR 704.09 crore in March 2024 to INR 732.89 crore in March 2025, although it has decreased from INR 713.40 crore in March 2023. The total operating income followed a similar pattern, reaching INR 732.89 crore in March 2025. However, total expenditure (excluding depreciation) decreased to INR 764.94 crore in March 2025 from INR 778.92 crore in March 2024. Operating profit (PBDIT) improved significantly to INR 107.77 crore in March 2025 from INR 31.73 crore in March 2024, indicating a recovery from negative operating profit in the previous years. Profit before tax also rebounded to INR 80.57 crore in March 2025, compared to a loss of INR 8.10 crore in March 2024. Consequently, profit after tax surged to INR 77.78 crore in March 2025, up from INR 9.42 crore in March 2024. The company's total assets increased to INR 2,258.39 crore in March 2025, while total liabilities rose slightly to INR 2,258.39 crore, reflecting a stable financial position. Cash flow from operating activities improved to INR 37 crore in March 2025, although the net cash outflow was recorded at INR 22 crore. Overall, Hindustan Media's financial performance indicates a recovery trajectory in 2025 after facing challenges in the preceding years.

View full answer

Are Hindustan Media Ventures Ltd latest results good or bad?

27-Jan-2026

Hindustan Media Ventures Ltd's latest results are concerning, showing a 7.48% revenue growth to ₹212.24 crores, but a drastic 95.05% decline in net profit to ₹0.89 crores, indicating significant operational challenges and inefficiencies. Overall, the results reflect more negative than positive trends.

Hindustan Media Ventures Ltd's latest results are concerning. While the company reported a year-on-year revenue growth of 7.48%, reaching ₹212.24 crores, this positive aspect is overshadowed by a dramatic decline in net profit, which plummeted by 95.05% to just ₹0.89 crores. This significant drop in profitability indicates severe operational challenges, as the company is struggling to convert its revenue into profit.<BR><BR>The operating margin remains negative at -0.36%, reflecting ongoing operational inefficiencies. Additionally, the company is heavily reliant on non-operating income, which accounted for an alarming 138.55% of profit before tax in the latest quarter. This dependency raises serious questions about the sustainability of its earnings.<BR><BR>Overall, the results suggest that while Hindustan Media Ventures is managing to grow its sales, it faces critical issues in profitability and operational efficiency, making the latest results more bad than good.

View full answer

Should I buy, sell or hold Hindustan Media Ventures Ltd?

27-Jan-2026

Why is Hindustan Media Ventures Ltd falling/rising?

27-Jan-2026

As of 27-Jan, Hindustan Media Ventures Ltd's stock is declining to Rs 68.00, down 4.55%, due to poor financial performance and negative market sentiment. The company faces significant challenges, including operating losses and a lack of investor confidence, contributing to its underperformance.

As of 27-Jan, Hindustan Media Ventures Ltd's stock price is falling, currently at Rs 68.00, which represents a decrease of Rs 3.24 or 4.55%. This decline is attributed to several factors. The stock has underperformed its sector by 2.9% today and has experienced a trend reversal, falling after two consecutive days of gains. Additionally, the stock reached an intraday low of Rs 67.35, reflecting a drop of 5.46%.<BR><BR>The company's performance metrics indicate significant challenges. It has reported operating losses, leading to a weak long-term fundamental strength, as evidenced by a poor EBIT to Interest ratio of -5.38. The recent quarterly results show a decline in profit after tax (PAT) by 44.7% compared to the previous four-quarter average, and cash and cash equivalents are at their lowest level of Rs 18.92 crore. Furthermore, the company has a negative EBITDA, which adds to the risk associated with its stock.<BR><BR>In terms of market performance, Hindustan Media Ventures Ltd has generated a return of -16.04% over the past year, significantly underperforming the Sensex, which has gained 8.61% in the same period. The stock has also been trading below its moving averages across various time frames, indicating a bearish trend. The lack of investment from domestic mutual funds, which hold 0% of the company, suggests a lack of confidence in its current valuation or business prospects.<BR><BR>Overall, these factors contribute to the stock's decline, reflecting a combination of poor financial performance, negative market sentiment, and underwhelming investor interest.

View full answer
iScoreScore
Click here to find our call on this stock
Strong Sell
Sell
Hold
Buy
Strong Buy

MarketsMojo — Loved in India, Now Global

The power of Mojo is now in 29 countries. Explore global equities with the same cutting-edge features you love.

Dashboard

1

With a Operating Losses, the company has a Weak Long Term Fundamental Strength

  • Company's ability to service its debt is weak with a poor EBIT to Interest (avg) ratio of -5.62
  • The company has reported losses. Due to this company has reported negative ROCE
2

Flat results in Dec 25

3

Risky - Negative EBITDA

4

Despite the size of the company, domestic mutual funds hold only 0% of the company

5

Below par performance in long term as well as near term

stock-summaryMojo Parameters

Mojo Parameters

Loading Valuation Snapshot...

Stock DNA

stock-summary
Industry

Media & Entertainment

stock-summary
Market cap

INR 510 Cr (Micro Cap)

stock-summary
P/E

6.00

stock-summary
Industry P/E

14

stock-summary
Dividend Yield

0.00%

stock-summary
Debt Equity

-0.59

stock-summary
Return on Equity

5.39%

stock-summary
Price to Book

0.32

Revenue and Profits:
Net Sales:
212 Cr
(Quarterly Results - Dec 2025)
Net Profit:
1 Cr
stock-summaryTotal Returns
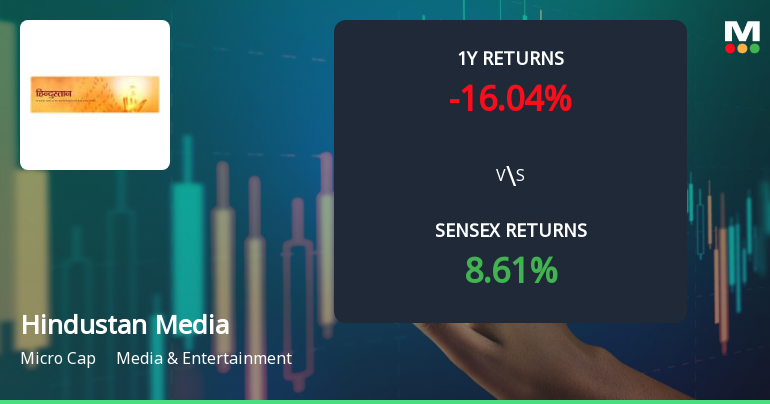
Total Returns (Price + Dividend) stock-summary
Dividend Yield (0%)
TimePeriod
Price Return
Dividend Return
Total Return
3 Months
-12.23%
0%
-12.23%
6 Months
-20.21%
0%
-20.21%
1 Year
-11.64%
0%
-11.64%
2 Years
-30.56%
0%
-30.56%
3 Years
35.66%
0%
35.66%
4 Years
-9.12%
0%
-9.12%
5 Years
31.34%
0%
31.34%

Latest dividend: 1.2 per share ex-dividend date: Sep-09-2019

Risk Adjusted Returns v/s stock-summary
Returns Beta
Icon
Beta has not been calculated since enough price history is not available
stock-summaryNews & Corporate Actions

News

Announcements stock-summary

Hindustan Media Ventures Limited - Other General Purpose

28-Nov-2019 | Source : NSE

Hindustan Media Ventures Limited has submitted to the Exchange a copy of disclosure of Related Party Transactions for the half year ended on September 30, 2019 pursuant to Regulation 23(9) of SEBI LODR.

Hindustan Media Ventures Limited - Updates

06-Nov-2019 | Source : NSE

Hindustan Media Ventures Limited has informed the Exchange regarding 'In furtherance to our letter dated 1st November, 2019 regarding submission of Un-audited Financial Results (Consolidated and Standalone) (UFRs) for the quarter and half year ended on September 30, 2019 along with Limited Review Report of Statutory Auditor thereon, copies of UFRs published in Hindustan Times , Hindustan and Mint newspapers on 2nd November, 2019, are enclosed herewith.

Hindustan Media Ventures Limited - Investor Presentation

04-Nov-2019 | Source : NSE

Hindustan Media Ventures Limited has informed the Exchange regarding Investor Presentation

Corporate Actions stock-summary

stock-summary
BOARD MEETING

No Upcoming Board Meetings

stock-summary
DIVIDEND

Hindustan Media Ventures Ltd has declared 12% dividend, ex-date: 09 Sep 19

stock-summary
SPLITS

No Splits history available

stock-summary
BONUS

No Bonus history available

stock-summary
RIGHTS

No Rights history available

stock-summaryKey Factors

Quality key factors stock-summary

Factor
Value
Sales Growth (5y)
7.20%
EBIT Growth (5y)
-1.79%
EBIT to Interest (avg)
-5.62
Debt to EBITDA (avg)
1.15
Net Debt to Equity (avg)
-0.59
Sales to Capital Employed (avg)
0.42
Tax Ratio
4.71%
Dividend Payout Ratio
0
Pledged Shares
0
Institutional Holding
0.18%
ROCE (avg)
-7.95%
ROE (avg)
2.35%

Valuation key factors

Factor
Value
P/E Ratio
6
Industry P/E
14
Price to Book Value
0.32
EV to EBIT
10.69
EV to EBITDA
20.05
EV to Capital Employed
-0.64
EV to Sales
-0.52
PEG Ratio
0.08
Dividend Yield
NA
ROCE (Latest)
Negative Capital Employed
ROE (Latest)
5.39%

Technicals key factors

Indicator
Weekly
Monthly
MACD
Mildly Bullish
Bearish
RSI
No Signal
No Signal
Bollinger Bands
Bearish
Bearish
Moving Averages
Bearish (Daily)
KST
Bearish
Bearish
Dow Theory
Mildly Bullish
No Trend
OBV
No Trend
No Trend
stock-summary Technical Indicator Scale: Bearish, Mildly Bearish, Sideways, Mildly Bullish, Bullish  Turned 
stock-summaryShareholding
Shareholding Snapshot : Dec 2025stock-summary
Shareholding Compare (%holding) stock-summary
Majority shareholders

Promoters

Pledged Promoter Holdings

None

Mutual Funds

Held by 0 Schemes

FIIs

Held by 5 FIIs (0.11%)

Promoter with highest holding

Ht Media Limited (74.4%)

Highest Public shareholder

Elimath Advisors Private Limited (6.51%)

Individual Investors Holdings

14.25%

stock-summaryFinancial
[
  {
    "link": "quarterly",
    "btn_text": "All Quarterly Results",
    "header": "Quarterly Results Snapshot (Consolidated) - Dec'25 - QoQ",
    "rhs": [
      {
        "prefix": "Net Sales ",
        "suffix": "QoQ Growth in quarter ended Dec 2025 is 7.81% vs 7.59% in Sep 2025",
        "dir": 1
      },
      {
        "prefix": "Consolidated Net Profit ",
        "suffix": "QoQ Growth in quarter ended Dec 2025 is -91.17% vs -1.56% in Sep 2025",
        "dir": -1
      }
    ],
    "table": {
      "header": [
        "Dec'25",
        "Sep'25",
        "Change(%)"
      ],
      "body": [
        {
          "field": "Net Sales",
          "val1": "212.24",
          "val2": "196.87",
          "chgp": "7.81%",
          "chgp_class": "positive"
        },
        {
          "field": "Operating Profit (PBDIT) excl Other Income",
          "val1": "-0.76",
          "val2": "-9.70",
          "chgp": "92.16%",
          "chgp_class": "positive"
        },
        {
          "field": "Interest",
          "val1": "2.18",
          "val2": "2.08",
          "chgp": "4.81%",
          "chgp_class": "negative"
        },
        {
          "field": "Exceptional Items",
          "val1": "-16.09",
          "val2": "0.00",
          "chgp": "",
          "chgp_class": "neutral"
        },
        {
          "field": "Consolidate Net Profit",
          "val1": "0.89",
          "val2": "10.08",
          "chgp": "-91.17%",
          "chgp_class": "negative"
        },
        {
          "field": "Operating Profit Margin (Excl OI)",
          "val1": "-0.36%",
          "val2": "-4.93%",
          "chgp": "4.57%",
          "chgp_class": "positive"
        }
      ]
    }
  },
  {
    "link": "half-yearly",
    "btn_text": "All Half Yearly Results",
    "header": "Half Yearly Results Snapshot (Consolidated) - Sep'25",
    "rhs": [
      {
        "prefix": "Net Sales ",
        "suffix": " Growth in half year ended Sep 2025 is 13.67% vs 0.32% in Sep 2024",
        "dir": 1
      },
      {
        "prefix": "Consolidated Net Profit ",
        "suffix": " Growth in half year ended Sep 2025 is 41.21% vs 47,866.67% in Sep 2024",
        "dir": -1
      }
    ],
    "table": {
      "header": [
        "Sep'25",
        "Sep'24",
        "Change(%)"
      ],
      "body": [
        {
          "field": "Net Sales",
          "val1": "379.86",
          "val2": "334.17",
          "chgp": "13.67%",
          "chgp_class": "positive"
        },
        {
          "field": "Operating Profit (PBDIT) excl Other Income",
          "val1": "-18.70",
          "val2": "-32.73",
          "chgp": "42.87%",
          "chgp_class": "positive"
        },
        {
          "field": "Interest",
          "val1": "3.55",
          "val2": "3.65",
          "chgp": "-2.74%",
          "chgp_class": "positive"
        },
        {
          "field": "Exceptional Items",
          "val1": "0.00",
          "val2": "0.00",
          "chgp": "",
          "chgp_class": "neutral"
        },
        {
          "field": "Consolidate Net Profit",
          "val1": "20.32",
          "val2": "14.39",
          "chgp": "41.21%",
          "chgp_class": "positive"
        },
        {
          "field": "Operating Profit Margin (Excl OI)",
          "val1": "-4.92%",
          "val2": "-9.79%",
          "chgp": "4.87%",
          "chgp_class": "positive"
        }
      ]
    }
  },
  {
    "link": "nine-monthly",
    "btn_text": "All Nine Monthly Results",
    "header": "Nine Monthly Results Snapshot (Consolidated) - Dec'25",
    "rhs": [
      {
        "prefix": "Net Sales ",
        "suffix": "YoY Growth in nine months ended Dec 2025 is 11.37% vs 3.02% in Dec 2024",
        "dir": 1
      },
      {
        "prefix": "Consolidated Net Profit ",
        "suffix": "YoY Growth in nine months ended Dec 2025 is -34.50% vs 4,198.73% in Dec 2024",
        "dir": -1
      }
    ],
    "table": {
      "header": [
        "Dec'25",
        "Dec'24",
        "Change(%)"
      ],
      "body": [
        {
          "field": "Net Sales",
          "val1": "592.10",
          "val2": "531.64",
          "chgp": "11.37%",
          "chgp_class": "positive"
        },
        {
          "field": "Operating Profit (PBDIT) excl Other Income",
          "val1": "-19.46",
          "val2": "-30.92",
          "chgp": "37.06%",
          "chgp_class": "positive"
        },
        {
          "field": "Interest",
          "val1": "5.73",
          "val2": "5.20",
          "chgp": "10.19%",
          "chgp_class": "negative"
        },
        {
          "field": "Exceptional Items",
          "val1": "-16.09",
          "val2": "0.00",
          "chgp": "",
          "chgp_class": "neutral"
        },
        {
          "field": "Consolidate Net Profit",
          "val1": "21.21",
          "val2": "32.38",
          "chgp": "-34.50%",
          "chgp_class": "negative"
        },
        {
          "field": "Operating Profit Margin (Excl OI)",
          "val1": "-3.29%",
          "val2": "-5.82%",
          "chgp": "2.53%",
          "chgp_class": "positive"
        }
      ]
    }
  },
  {
    "link": "annual",
    "btn_text": "All Annual Results",
    "header": "Annual Results Snapshot (Consolidated) - Mar'25",
    "rhs": [
      {
        "prefix": "Net Sales ",
        "suffix": "YoY Growth in year ended Mar 2025 is 4.09% vs -1.31% in Mar 2024",
        "dir": 1
      },
      {
        "prefix": "Consolidated Net Profit ",
        "suffix": "YoY Growth in year ended Mar 2025 is 681.71% vs 126.12% in Mar 2024",
        "dir": 1
      }
    ],
    "table": {
      "header": [
        "Mar'25",
        "Mar'24",
        "Change(%)"
      ],
      "body": [
        {
          "field": "Net Sales",
          "val1": "732.89",
          "val2": "704.09",
          "chgp": "4.09%",
          "chgp_class": "positive"
        },
        {
          "field": "Operating Profit (PBDIT) excl Other Income",
          "val1": "-32.05",
          "val2": "-74.83",
          "chgp": "57.17%",
          "chgp_class": "positive"
        },
        {
          "field": "Interest",
          "val1": "6.63",
          "val2": "13.17",
          "chgp": "-49.66%",
          "chgp_class": "positive"
        },
        {
          "field": "Exceptional Items",
          "val1": "0.00",
          "val2": "0.00",
          "chgp": "",
          "chgp_class": "neutral"
        },
        {
          "field": "Consolidate Net Profit",
          "val1": "77.78",
          "val2": "9.95",
          "chgp": "681.71%",
          "chgp_class": "positive"
        },
        {
          "field": "Operating Profit Margin (Excl OI)",
          "val1": "-4.37%",
          "val2": "-10.63%",
          "chgp": "6.26%",
          "chgp_class": "positive"
        }
      ]
    }
  }
]

Quarterly Results Snapshot (Consolidated) - Dec'25 - QoQstock-summary

Dec'25
Sep'25
Change(%)
Net Sales
212.24
196.87
7.81%
Operating Profit (PBDIT) excl Other Income
-0.76
-9.70
92.16%
Interest
2.18
2.08
4.81%
Exceptional Items
-16.09
0.00
Consolidate Net Profit
0.89
10.08
-91.17%
Operating Profit Margin (Excl OI)
-0.36%
-4.93%
4.57%
Values in Rs Cr.
Direction Arrows
Net Sales

QoQ Growth in quarter ended Dec 2025 is 7.81% vs 7.59% in Sep 2025

Direction Arrows
Consolidated Net Profit

QoQ Growth in quarter ended Dec 2025 is -91.17% vs -1.56% in Sep 2025

Half Yearly Results Snapshot (Consolidated) - Sep'25stock-summary

Sep'25
Sep'24
Change(%)
Net Sales
379.86
334.17
13.67%
Operating Profit (PBDIT) excl Other Income
-18.70
-32.73
42.87%
Interest
3.55
3.65
-2.74%
Exceptional Items
0.00
0.00
Consolidate Net Profit
20.32
14.39
41.21%
Operating Profit Margin (Excl OI)
-4.92%
-9.79%
4.87%
Values in Rs Cr.
Direction Arrows
Net Sales

Growth in half year ended Sep 2025 is 13.67% vs 0.32% in Sep 2024

Direction Arrows
Consolidated Net Profit

Growth in half year ended Sep 2025 is 41.21% vs 47,866.67% in Sep 2024

Nine Monthly Results Snapshot (Consolidated) - Dec'25stock-summary

Dec'25
Dec'24
Change(%)
Net Sales
592.10
531.64
11.37%
Operating Profit (PBDIT) excl Other Income
-19.46
-30.92
37.06%
Interest
5.73
5.20
10.19%
Exceptional Items
-16.09
0.00
Consolidate Net Profit
21.21
32.38
-34.50%
Operating Profit Margin (Excl OI)
-3.29%
-5.82%
2.53%
Values in Rs Cr.
Direction Arrows
Net Sales

YoY Growth in nine months ended Dec 2025 is 11.37% vs 3.02% in Dec 2024

Direction Arrows
Consolidated Net Profit

YoY Growth in nine months ended Dec 2025 is -34.50% vs 4,198.73% in Dec 2024

Annual Results Snapshot (Consolidated) - Mar'25stock-summary

Mar'25
Mar'24
Change(%)
Net Sales
732.89
704.09
4.09%
Operating Profit (PBDIT) excl Other Income
-32.05
-74.83
57.17%
Interest
6.63
13.17
-49.66%
Exceptional Items
0.00
0.00
Consolidate Net Profit
77.78
9.95
681.71%
Operating Profit Margin (Excl OI)
-4.37%
-10.63%
6.26%
Values in Rs Cr.
Direction Arrows
Net Sales

YoY Growth in year ended Mar 2025 is 4.09% vs -1.31% in Mar 2024

Direction Arrows
Consolidated Net Profit

YoY Growth in year ended Mar 2025 is 681.71% vs 126.12% in Mar 2024

stock-summaryCompany CV
About Hindustan Media Ventures Ltd stock-summary
stock-summary
Hindustan Media Ventures Ltd
Micro Cap
Media & Entertainment
Hindustan Media Ventures Limited (HMVL) was incorporated on July 9, 1918 as a public limited company as 'The Behar Journals Limited'. On November 17, 1987 the name of the company was changed from The Behar Journals Limited to Searchlight Publishing House Limited and further in November 2008 to Hindustan Media Ventures Limited. HT Media Limited holds 74.40% of Equity Share Capital of the Company.
Company Coordinates stock-summary
Company Details
Budh Marg , Patna Bihar : 800001
stock-summary
Tel: 91-0612-2223434
stock-summary
hmvlinvestor@livehindustan.com
Registrar Details
Karvy Computershare Pvt Ltd, Plot No 17-24 , Near Image Hospital,, Reliance Cybervilae,Vithalrao Nagar,, Madhapur, Hyderabad