R K Swamy

  • Market Cap: Micro Cap
  • Industry: Media & Entertainment
  • ISIN: INE0NQ801033
  • NSEID: RKSWAMY
  • BSEID: 544136
INR
98.77
-0.38 (-0.38%)
BSENSE

Mar 05

BSE+NSE Vol: 40.68 k

  • Price Points
  • Score
  • Mojo Parameters
  • Total Return
  • News and Corporate Actions
  • Key factors
  • Shareholding
  • Financials
  • CompanyCV
stock-summaryPrice Point
High/Low

1Day

52 Week

Valuation
Technical
Day's Volume

CASH

40.68 k (-14.63%) Volume

Shareholding (Dec 2025)

FII

0.18%

Held by 1 FIIs

DII

-0.00%

Held by 5 DIIs

Promoter

69.61%

Has R K Swamy declared dividend?

06-Jun-2025

R K Swamy Ltd has declared a 40% dividend, amounting to ₹2 per share, with an ex-date of August 9, 2024. However, the company has experienced significant price declines, resulting in total returns of -17.56% over the last 6 months and -24.68% over the past year.

R K Swamy Ltd has declared a 40% dividend.<BR><BR>Dividend Details:<BR>- Percentage announced: 40%<BR>- Amount per share: 2<BR>- Ex-date: 09 Aug 24<BR><BR>Dividend Yield: 1.02%.<BR><BR>Total Returns by Period:<BR>In the last 6 months, the price return was -17.56%, the dividend return was 0%, resulting in a total return of -17.56%.<BR><BR>Over the past year, the price return was -25.42%, the dividend return was 0.74%, leading to a total return of -24.68%.<BR><BR>For the 2-year period, there was no price return, no dividend return, and thus a total return of 0.0%.<BR><BR>In the 3-year period, the price return was 0%, the dividend return was 0%, resulting in a total return of 0.0%.<BR><BR>During the 4-year period, there was no price return, no dividend return, leading to a total return of 0.0%.<BR><BR>In the 5-year period, the price return was 0%, the dividend return was 0%, resulting in a total return of 0.0%.<BR><BR>Overall, while R K Swamy Ltd has declared a dividend, the total returns over various periods indicate a significant decline in price returns, particularly in the last year, suggesting challenges in the company's performance.

View full answer

Who are the peers of the R K Swamy?

16-Jul-2025

R K Swamy's peers include Dish TV India, T.V. Today Network, NDTV, Zee Media, Sandesh, Bright Outdoor, Ent.Network, Hindustan Media, and OnMobile Global. R K Swamy has average growth and excellent capital structure, with a 1-year return of -37.24%, better than Dish TV India's -61.04%.

Peers: The peers of R K Swamy are Dish TV India, T.V. Today Netw., NDTV, Zee Media, Sandesh, Bright Outdoor, Ent.Network, Hindustan Media, and OnMobile Global.<BR><BR>Quality Snapshot: Excellent management risk is observed at T.V. Today Netw. and R K Swamy, while Average management risk is found at Dish TV India, NDTV, Zee Media, Sandesh, and Ent.Network, and the rest. Below Average management risk is noted for Bright Outdoor, Hindustan Media, and OnMobile Global. Growth is Excellent at Bright Outdoor, Average at R K Swamy, and Below Average at Dish TV India, T.V. Today Netw., NDTV, Zee Media, Sandesh, Ent.Network, Hindustan Media, and OnMobile Global, and the rest. Capital Structure is Excellent at R K Swamy, T.V. Today Netw., and Sandesh, Average at Dish TV India and Bright Outdoor, Good at Ent.Network, and Below Average at NDTV, Zee Media, Hindustan Media, and OnMobile Global, and the rest.<BR><BR>Return Snapshot: Bright Outdoor has the highest 1-year return at 30.82%, while Dish TV India has the lowest at -61.04%. R K Swamy's 1-year return of -37.24% is better than Dish TV India's but worse than Bright Outdoor's. Additionally, the six-month return is negative for Dish TV India, T.V. Today Netw., Sandesh, Hindustan Media, and OnMobile Global.

View full answer

What does R K Swamy do?

17-Jul-2025

R K Swamy Ltd is a Micro Cap company in the Media & Entertainment industry, originally founded in 1973, with recent net sales of 835 Cr and a net profit of 123 Cr as of March 2025. Key metrics include a P/E ratio of 48.00 and a market cap of INR 895 Cr.

Overview:<BR>R K Swamy Ltd operates in the Media & Entertainment industry and is categorized as a Micro Cap company.<BR><BR>History:<BR>The company was originally incorporated on February 16, 1973, as R. K. Swamy Advertising Associates Private Limited. It changed its name to R. K. Swamy BBDO Advertising Private Limited on September 11, 1990. The latest quarterly results report net sales and profit for the period ending March 2025.<BR><BR>Financial Snapshot:<BR>Most recent Net Sales: 835 Cr (Quarterly Results - Mar 2025) <BR>Most recent Net Profit: 123 Cr (Quarterly Results - Mar 2025) <BR>Market-cap value: INR 895 Cr (Micro Cap)<BR><BR>Key Metrics:<BR>P/E: 48.00 <BR>Industry P/E: 32 <BR>Dividend Yield: 1.14% <BR>Debt Equity: -0.44 <BR>Return on Equity: 14.77% <BR>Price to Book: 3.78 <BR><BR>Contact Details:<BR>Address: Not available <BR>Phone: N/A <BR>Email: N/A <BR>Website: N/A

View full answer

Who are the top shareholders of the R K Swamy?

17-Jul-2025

The top shareholders of R K Swamy include Narasimhan K Swamy with 32.9%, mutual funds at 5.46%, foreign institutional investors at 0.79%, and Nippon Life India Trustee Ltd as the highest public shareholder at 4.19%. Individual investors collectively own 18.17% of the company.

The top shareholders of R K Swamy include the promoters, with Narasimhan K Swamy holding the largest share at 32.9%. Additionally, mutual funds hold a combined 5.46% through two schemes, while foreign institutional investors (FIIs) account for 0.79% through six different entities. The highest public shareholder is Nippon Life India Trustee Ltd, which holds 4.19%. Individual investors collectively own 18.17% of the company.

View full answer

How big is R K Swamy?

24-Jul-2025

As of 24th July, R K Swamy Ltd has a market capitalization of 879.00 Cr, with recent net sales of 294.29 Cr and a net profit of 18.66 Cr over the last four quarters. Shareholder's funds are 241.35 Cr, and total assets amount to 391.83 Cr as of March 2024.

As of 24th July, <BR><BR>Market Cap: R K Swamy Ltd has a market capitalization of 879.00 Cr, categorizing it as a Micro Cap company.<BR><BR>Recent Quarterly Performance: The sum of Net Sales for the latest 4 quarters is 294.29 Cr, while the sum of Net Profit for the same period is 18.66 Cr.<BR><BR>Balance Sheet Snapshot: The reporting period for the latest annual data is March 2024. Shareholder's Funds stand at 241.35 Cr, and Total Assets amount to 391.83 Cr.

View full answer

When is the next results date for R K Swamy?

06-Aug-2025

R K Swamy will announce its results on 12 August 2025.

R K Swamy is scheduled to declare its results on 12 August 2025.

View full answer

Are R K Swamy latest results good or bad?

13-Aug-2025

R K Swamy's latest financial results are concerning, with a 38.5% decline in Profit After Tax and a heavy reliance on non-operating income, leading to a 'Sell' recommendation from MarketsMOJO. Overall, the company's performance is characterized as bad, indicating significant financial challenges.

R K Swamy's latest financial results are concerning. For the quarter ending June 2025, the company reported a Profit After Tax (PAT) of Rs 2.87 crore, which is a significant decline of 38.5% compared to the average PAT of Rs 4.67 crore from the previous four quarters. This decline suggests that the company is facing a challenging financial environment.<BR><BR>Moreover, the company's reliance on non-operating income is alarming, as it accounted for 74.44% of the Profit Before Tax (PBT). This heavy dependence on non-business activities raises questions about the sustainability of its earnings and long-term growth prospects.<BR><BR>The overall performance metrics also reflect a downward trend, with net sales decreasing by 7.11% and consolidated net profit dropping by 76.72% compared to the previous quarter. Given these results, MarketsMOJO has issued a 'Sell' call on R K Swamy's stock, indicating a negative outlook on the company's performance. Overall, the results can be characterized as bad, highlighting significant financial challenges for the company.

View full answer

How has been the historical performance of R K Swamy?

13-Aug-2025

R K Swamy's historical performance shows a decline in net sales, operating profit, and profit after tax from March 2024 to March 2025, alongside negative cash flow from operating activities. Total liabilities remained stable while total assets did not change, indicating challenges in growth and profitability.

Answer:<BR>The historical performance of R K Swamy shows a fluctuating trend in key financial metrics over the years.<BR><BR>Breakdown:<BR>R K Swamy's net sales experienced a decline from INR 331.52 crore in March 2024 to INR 294.29 crore in March 2025, while total operating income also decreased slightly from INR 331.52 crore to INR 294.29 crore during the same period. The company's total expenditure, excluding depreciation, increased marginally from INR 261.10 crore in March 2024 to INR 264.75 crore in March 2025. Operating profit, however, saw a significant drop from INR 74.30 crore in March 2024 to INR 41.41 crore in March 2025, leading to a decrease in profit before tax from INR 53.57 crore to INR 24.77 crore. Consequently, profit after tax also fell from INR 39.72 crore to INR 18.66 crore. The earnings per share (EPS) decreased from INR 7.87 to INR 3.7, reflecting the overall decline in profitability. On the balance sheet, total liabilities rose from INR 391.81 crore in March 2024 to INR 391.81 crore in March 2025, while total assets remained stable at INR 391.81 crore. Cash flow from operating activities turned negative at INR -10 crore in March 2025, contrasting with a positive cash flow of INR 11 crore in March 2024. Overall, R K Swamy's financial performance in the latest fiscal year indicates challenges in maintaining growth and profitability.

View full answer

Is R K Swamy technically bullish or bearish?

04-Nov-2025

As of November 3, 2025, R K Swamy's technical outlook is bearish, indicated by a bearish MACD, Bollinger Bands, and moving averages, along with significant underperformance compared to the Sensex.

As of 3 November 2025, the technical trend has changed from mildly bearish to bearish. The current technical stance for R K Swamy is bearish with a strong indication of weakness. Key indicators driving this stance include a bearish MACD on the weekly chart, bearish Bollinger Bands on both weekly and monthly time frames, and bearish moving averages on the daily chart. The stock has also shown significant underperformance compared to the Sensex over the past month and year, further reinforcing the bearish outlook.

View full answer

Is R K Swamy overvalued or undervalued?

17-Nov-2025

As of November 14, 2025, R K Swamy is considered an attractive investment opportunity in the media and entertainment sector, with a PE ratio of 33.89 indicating it is undervalued compared to peers like Altius Telecom and Embassy Office REIT, despite a year-to-date return of -51.66% versus the Sensex's 8.22%.

As of 14 November 2025, R K Swamy's valuation grade has moved from fair to attractive, indicating a more favorable outlook for the company. The stock is currently assessed as undervalued, with a PE ratio of 33.89, an EV to EBITDA of 17.11, and a PEG ratio of 0.00, suggesting potential for growth without the corresponding valuation premium. <BR><BR>In comparison to its peers, R K Swamy's PE ratio is lower than Altius Telecom, which has a PE of 51.5, and significantly more attractive than Embassy Office REIT, which is considered very expensive at a PE of 130.21. Despite recent stock performance lagging behind the Sensex, with a year-to-date return of -51.66% compared to the Sensex's 8.22%, the current valuation metrics suggest that R K Swamy presents a compelling investment opportunity in the media and entertainment sector.

View full answer

Should I buy, sell or hold R K Swamy Ltd?

15-Feb-2026

Why is R K Swamy Ltd falling/rising?

05-Mar-2026

As of 04-Mar, R K Swamy Ltd's stock price is at 99.37, down 0.22%. The stock is in a bearish trend, underperforming against the Sensex, with significant declines over various time frames, despite increased investor interest.

As of 04-Mar, R K Swamy Ltd's stock price is currently at 99.37, reflecting a decrease of 0.22 (-0.22%). The stock has been experiencing a downward trend, having fallen consecutively for the last two days, resulting in a total decline of -0.33% during this period. Additionally, the stock is trading below its 5-day, 20-day, 50-day, 100-day, and 200-day moving averages, indicating a bearish trend.<BR><BR>In terms of broader market performance, R K Swamy Ltd has underperformed compared to the benchmark Sensex, which has seen a decline of -3.84% over the past week, while the stock itself has gained 0.58%. However, over the past month, the stock has dropped significantly by -13.37%, compared to a smaller decline of -5.61% for the Sensex. Year-to-date, R K Swamy Ltd is down -11.24%, while the Sensex is down -7.16%. Over the past year, the stock has plummeted by -50.39%, contrasting sharply with the Sensex's gain of +8.39%.<BR><BR>Despite these negative trends, there has been a notable increase in investor participation, with delivery volume rising by 54.09% against the 5-day average, suggesting some interest in the stock. However, the overall performance and the stock's proximity to its 52-week low, just 2.39% away, indicate ongoing challenges for R K Swamy Ltd. The sector in which it operates has also seen a decline of -2.3%, contributing to the stock's struggles.

View full answer
iScoreScore
Click here to find our call on this stock
Strong Sell
Sell
Hold
Buy
Strong Buy

Dashboard

1

Poor long term growth as Operating profit has grown by an annual rate -34.98% of over the last 5 years

 
2

Flat results in Dec 25

3

With ROE of 7.9, it has a Expensive valuation with a 2 Price to Book Value

4

Falling Participation by Institutional Investors

5

Below par performance in long term as well as near term

stock-summaryMojo Parameters

Mojo Parameters

Loading Valuation Snapshot...

Stock DNA

stock-summary
Industry

Media & Entertainment

stock-summary
Market cap

INR 503 Cr (Micro Cap)

stock-summary
P/E

23.00

stock-summary
Industry P/E

32

stock-summary
Dividend Yield

1.51%

stock-summary
Debt Equity

-0.30

stock-summary
Return on Equity

7.89%

stock-summary
Price to Book

2.04

Revenue and Profits:
Net Sales:
89 Cr
(Quarterly Results - Dec 2025)
Net Profit:
3 Cr
stock-summaryTotal Returns
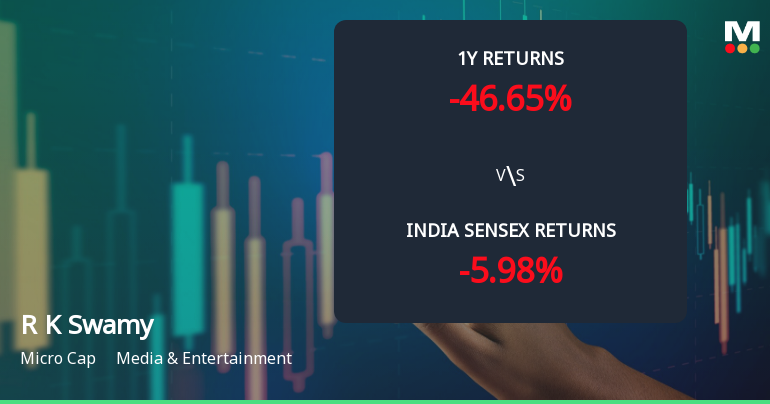
Total Returns (Price + Dividend) stock-summary
Dividend Yield (1.51%)
TimePeriod
Price Return
Dividend Return
Total Return
3 Months
-12.95%
0%
-12.95%
6 Months
-35.41%
0%
-35.41%
1 Year
-51.26%
0.77%
-50.49%
2 Years
0%
1.29%
1.29%
3 Years
0%
0%
0.0%
4 Years
0%
0%
0.0%
5 Years
0%
0%
0.0%

Latest dividend: 1.5 per share ex-dividend date: Aug-19-2025

Risk Adjusted Returns v/s stock-summary
Returns Beta
Icon
Beta has not been calculated since enough price history is not available
stock-summaryNews & Corporate Actions

News

stock-summaryKey Factors

Quality key factors stock-summary

Factor
Value
Sales Growth (5y)
4.53%
EBIT Growth (5y)
-34.98%
EBIT to Interest (avg)
9.17
Debt to EBITDA (avg)
0.69
Net Debt to Equity (avg)
-0.30
Sales to Capital Employed (avg)
1.18
Tax Ratio
26.07%
Dividend Payout Ratio
25.41%
Pledged Shares
0
Institutional Holding
5.18%
ROCE (avg)
27.63%
ROE (avg)
7.89%

Valuation key factors

Factor
Value
P/E Ratio
23
Industry P/E
32
Price to Book Value
2.03
EV to EBIT
21.06
EV to EBITDA
11.24
EV to Capital Employed
2.46
EV to Sales
1.31
PEG Ratio
NA
Dividend Yield
1.52%
ROCE (Latest)
10.16%
ROE (Latest)
7.89%

Technicals key factors

Indicator
Weekly
Monthly
MACD
Mildly Bullish
RSI
Bullish
Bullish
Bollinger Bands
Bearish
Bearish
Moving Averages
Bearish (Daily)
KST
Mildly Bullish
Dow Theory
No Trend
No Trend
OBV
No Trend
No Trend
stock-summary Technical Indicator Scale: Bearish, Mildly Bearish, Sideways, Mildly Bullish, Bullish  Turned 
stock-summaryShareholding
Shareholding Snapshot : Dec 2025stock-summary
Shareholding Compare (%holding) stock-summary
Majority shareholders

Promoters

Pledged Promoter Holdings

None

Mutual Funds

Held by 1 Schemes (3.44%)

FIIs

Held by 1 FIIs (0.18%)

Promoter with highest holding

Narasimhan K Swamy (32.9%)

Highest Public shareholder

Nippon Life India Trustee Ltd-a/c (3.44%)

Individual Investors Holdings

20.28%

stock-summaryFinancial
[
  {
    "link": "quarterly",
    "btn_text": "All Quarterly Results",
    "header": "Quarterly Results Snapshot (Consolidated) - Dec'25 - QoQ",
    "rhs": [
      {
        "prefix": "Net Sales ",
        "suffix": "QoQ Growth in quarter ended Dec 2025 is 20.38% vs -5.05% in Sep 2025",
        "dir": 1
      },
      {
        "prefix": "Consolidated Net Profit ",
        "suffix": "QoQ Growth in quarter ended Dec 2025 is 409.26% vs -81.18% in Sep 2025",
        "dir": 1
      }
    ],
    "table": {
      "header": [
        "Dec'25",
        "Sep'25",
        "Change(%)"
      ],
      "body": [
        {
          "field": "Net Sales",
          "val1": "88.66",
          "val2": "73.65",
          "chgp": "20.38%",
          "chgp_class": "positive"
        },
        {
          "field": "Operating Profit (PBDIT) excl Other Income",
          "val1": "9.66",
          "val2": "5.94",
          "chgp": "62.63%",
          "chgp_class": "positive"
        },
        {
          "field": "Interest",
          "val1": "0.95",
          "val2": "0.88",
          "chgp": "7.95%",
          "chgp_class": "negative"
        },
        {
          "field": "Exceptional Items",
          "val1": "-3.07",
          "val2": "0.00",
          "chgp": "",
          "chgp_class": "neutral"
        },
        {
          "field": "Consolidate Net Profit",
          "val1": "2.75",
          "val2": "0.54",
          "chgp": "409.26%",
          "chgp_class": "positive"
        },
        {
          "field": "Operating Profit Margin (Excl OI)",
          "val1": "10.90%",
          "val2": "8.07%",
          "chgp": "2.83%",
          "chgp_class": "positive"
        }
      ]
    }
  },
  {
    "link": "half-yearly",
    "btn_text": "All Half Yearly Results",
    "header": "Half Yearly Results Snapshot (Consolidated) - Sep'25",
    "rhs": [
      {
        "prefix": "Net Sales ",
        "suffix": " Growth in half year ended Sep 2025 is 12.86% vs -5.04% in Sep 2024",
        "dir": 1
      },
      {
        "prefix": "Consolidated Net Profit ",
        "suffix": " Growth in half year ended Sep 2025 is 26.30% vs -65.95% in Sep 2024",
        "dir": 1
      }
    ],
    "table": {
      "header": [
        "Sep'25",
        "Sep'24",
        "Change(%)"
      ],
      "body": [
        {
          "field": "Net Sales",
          "val1": "151.22",
          "val2": "133.99",
          "chgp": "12.86%",
          "chgp_class": "positive"
        },
        {
          "field": "Operating Profit (PBDIT) excl Other Income",
          "val1": "12.05",
          "val2": "7.48",
          "chgp": "61.10%",
          "chgp_class": "positive"
        },
        {
          "field": "Interest",
          "val1": "1.73",
          "val2": "0.88",
          "chgp": "96.59%",
          "chgp_class": "negative"
        },
        {
          "field": "Exceptional Items",
          "val1": "0.00",
          "val2": "0.00",
          "chgp": "",
          "chgp_class": "neutral"
        },
        {
          "field": "Consolidate Net Profit",
          "val1": "3.41",
          "val2": "2.70",
          "chgp": "26.30%",
          "chgp_class": "positive"
        },
        {
          "field": "Operating Profit Margin (Excl OI)",
          "val1": "7.97%",
          "val2": "5.58%",
          "chgp": "2.39%",
          "chgp_class": "positive"
        }
      ]
    }
  },
  {
    "link": "nine-monthly",
    "btn_text": "All Nine Monthly Results",
    "header": "Nine Monthly Results Snapshot (Consolidated) - Dec'25",
    "rhs": [
      {
        "prefix": "Net Sales ",
        "suffix": "YoY Growth in nine months ended Dec 2025 is 13.81% vs -1.15% in Dec 2024",
        "dir": 1
      },
      {
        "prefix": "Consolidated Net Profit ",
        "suffix": "YoY Growth in nine months ended Dec 2025 is -2.69% vs -53.28% in Dec 2024",
        "dir": 1
      }
    ],
    "table": {
      "header": [
        "Dec'25",
        "Dec'24",
        "Change(%)"
      ],
      "body": [
        {
          "field": "Net Sales",
          "val1": "239.88",
          "val2": "210.78",
          "chgp": "13.81%",
          "chgp_class": "positive"
        },
        {
          "field": "Operating Profit (PBDIT) excl Other Income",
          "val1": "21.71",
          "val2": "13.42",
          "chgp": "61.77%",
          "chgp_class": "positive"
        },
        {
          "field": "Interest",
          "val1": "2.68",
          "val2": "1.45",
          "chgp": "84.83%",
          "chgp_class": "negative"
        },
        {
          "field": "Exceptional Items",
          "val1": "-3.07",
          "val2": "0.00",
          "chgp": "",
          "chgp_class": "neutral"
        },
        {
          "field": "Consolidate Net Profit",
          "val1": "6.16",
          "val2": "6.33",
          "chgp": "-2.69%",
          "chgp_class": "negative"
        },
        {
          "field": "Operating Profit Margin (Excl OI)",
          "val1": "9.05%",
          "val2": "6.37%",
          "chgp": "2.68%",
          "chgp_class": "positive"
        }
      ]
    }
  },
  {
    "link": "annual",
    "btn_text": "All Annual Results",
    "header": "Annual Results Snapshot (Consolidated) - Mar'25",
    "rhs": [
      {
        "prefix": "Net Sales ",
        "suffix": "YoY Growth in year ended Mar 2025 is -11.23% vs 13.30% in Mar 2024",
        "dir": -1
      },
      {
        "prefix": "Consolidated Net Profit ",
        "suffix": "YoY Growth in year ended Mar 2025 is -53.02% vs 27.06% in Mar 2024",
        "dir": -1
      }
    ],
    "table": {
      "header": [
        "Mar'25",
        "Mar'24",
        "Change(%)"
      ],
      "body": [
        {
          "field": "Net Sales",
          "val1": "294.29",
          "val2": "331.52",
          "chgp": "-11.23%",
          "chgp_class": "negative"
        },
        {
          "field": "Operating Profit (PBDIT) excl Other Income",
          "val1": "29.54",
          "val2": "70.42",
          "chgp": "-58.05%",
          "chgp_class": "negative"
        },
        {
          "field": "Interest",
          "val1": "2.10",
          "val2": "5.77",
          "chgp": "-63.60%",
          "chgp_class": "positive"
        },
        {
          "field": "Exceptional Items",
          "val1": "0.00",
          "val2": "0.00",
          "chgp": "",
          "chgp_class": "neutral"
        },
        {
          "field": "Consolidate Net Profit",
          "val1": "18.66",
          "val2": "39.72",
          "chgp": "-53.02%",
          "chgp_class": "negative"
        },
        {
          "field": "Operating Profit Margin (Excl OI)",
          "val1": "10.04%",
          "val2": "21.24%",
          "chgp": "-11.20%",
          "chgp_class": "negative"
        }
      ]
    }
  }
]

Quarterly Results Snapshot (Consolidated) - Dec'25 - QoQstock-summary

Dec'25
Sep'25
Change(%)
Net Sales
88.66
73.65
20.38%
Operating Profit (PBDIT) excl Other Income
9.66
5.94
62.63%
Interest
0.95
0.88
7.95%
Exceptional Items
-3.07
0.00
Consolidate Net Profit
2.75
0.54
409.26%
Operating Profit Margin (Excl OI)
10.90%
8.07%
2.83%
Values in Rs Cr.
Direction Arrows
Net Sales

QoQ Growth in quarter ended Dec 2025 is 20.38% vs -5.05% in Sep 2025

Direction Arrows
Consolidated Net Profit

QoQ Growth in quarter ended Dec 2025 is 409.26% vs -81.18% in Sep 2025

Half Yearly Results Snapshot (Consolidated) - Sep'25stock-summary

Sep'25
Sep'24
Change(%)
Net Sales
151.22
133.99
12.86%
Operating Profit (PBDIT) excl Other Income
12.05
7.48
61.10%
Interest
1.73
0.88
96.59%
Exceptional Items
0.00
0.00
Consolidate Net Profit
3.41
2.70
26.30%
Operating Profit Margin (Excl OI)
7.97%
5.58%
2.39%
Values in Rs Cr.
Direction Arrows
Net Sales

Growth in half year ended Sep 2025 is 12.86% vs -5.04% in Sep 2024

Direction Arrows
Consolidated Net Profit

Growth in half year ended Sep 2025 is 26.30% vs -65.95% in Sep 2024

Nine Monthly Results Snapshot (Consolidated) - Dec'25stock-summary

Dec'25
Dec'24
Change(%)
Net Sales
239.88
210.78
13.81%
Operating Profit (PBDIT) excl Other Income
21.71
13.42
61.77%
Interest
2.68
1.45
84.83%
Exceptional Items
-3.07
0.00
Consolidate Net Profit
6.16
6.33
-2.69%
Operating Profit Margin (Excl OI)
9.05%
6.37%
2.68%
Values in Rs Cr.
Direction Arrows
Net Sales

YoY Growth in nine months ended Dec 2025 is 13.81% vs -1.15% in Dec 2024

Direction Arrows
Consolidated Net Profit

YoY Growth in nine months ended Dec 2025 is -2.69% vs -53.28% in Dec 2024

Annual Results Snapshot (Consolidated) - Mar'25stock-summary

Mar'25
Mar'24
Change(%)
Net Sales
294.29
331.52
-11.23%
Operating Profit (PBDIT) excl Other Income
29.54
70.42
-58.05%
Interest
2.10
5.77
-63.60%
Exceptional Items
0.00
0.00
Consolidate Net Profit
18.66
39.72
-53.02%
Operating Profit Margin (Excl OI)
10.04%
21.24%
-11.20%
Values in Rs Cr.
Direction Arrows
Net Sales

YoY Growth in year ended Mar 2025 is -11.23% vs 13.30% in Mar 2024

Direction Arrows
Consolidated Net Profit

YoY Growth in year ended Mar 2025 is -53.02% vs 27.06% in Mar 2024

stock-summaryCompany CV
About R K Swamy Ltd stock-summary
stock-summary
R K Swamy Ltd
Micro Cap
Media & Entertainment
R K Swamy Limited was originally incorporated on February 16, 1973, as `R. K. Swamy Advertising Associates Private Limited', a private limited company, pursuant to a certificate of incorporation issued by the Registrar of Companies, Tamil Nadu at Madras. The name of the Company was changed from `R. K. Swamy Advertising Associates Private Limited' to `R. K. Swamy BBDO Advertising Private Limited' dated September 11, 1990.
Company Coordinates stock-summary
Icon
No Company Details Available