
 Price Point
Compare Natl. Aluminium with Similar Stocks
ScoreDashboard
Strong Long Term Fundamental Strength with an average Return on Equity (ROE) of 20.50%
- Healthy long term growth as Operating profit has grown by an annual rate 39.10%
- The company is Net-Debt Free
- INVENTORY TURNOVER RATIO(HY) Highest at 9.72 times
- NET SALES(Q) Highest at Rs 5,302.38 cr
- PBDIT(Q) Highest at Rs 2,707.50 cr.
With ROE of 26.8, it has a Expensive valuation with a 3 Price to Book Value
High Institutional Holdings at 33.21%
Mojo ParametersStock DNA

Non - Ferrous Metals

INR 63,915 Cr (Mid Cap)

9.00
11

3.30%

-0.40

26.83%

2.96
Total ReturnsTotal Returns (Price + Dividend) 
Latest dividend: 1 per share ex-dividend date: Aug-24-2026
Risk Adjusted Returns v/s
Returns Beta
 News & Corporate Actions
News
National Aluminium Company Ltd Downgraded to Hold Amid Mixed Technical and Valuation Signals
National Aluminium Company Ltd (NACL), a prominent player in the Non-Ferrous Metals sector, has seen its investment rating downgraded from Buy to Hold as of 28 Sep 2026. This revision reflects a nuanced reassessment across four critical parameters: Quality, Valuation, Financial Trend, and Technicals. While the company continues to demonstrate strong fundamentals and impressive long-term returns, recent technical indicators and valuation metrics have prompted a more cautious stance among analysts.
Read full news article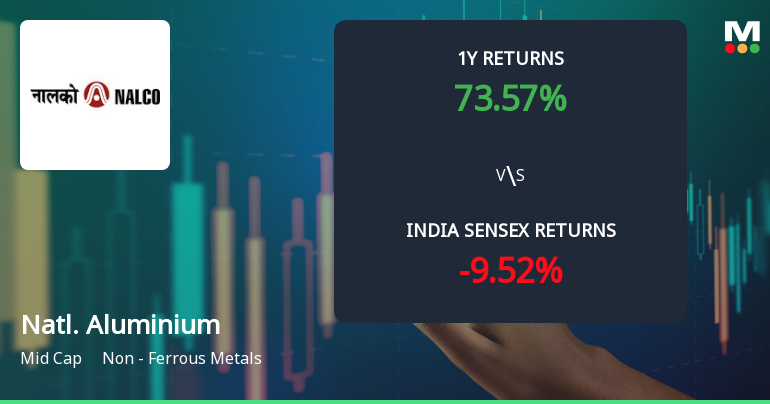
National Aluminium Company Ltd Technical Momentum Shifts Amid Mixed Market Signals
National Aluminium Company Ltd (NACL) has experienced a notable shift in its technical momentum, moving from a mildly bullish stance to a mildly bearish trend as of late September 2026. This transition is underscored by a combination of weakening moving averages, bearish MACD signals, and mixed readings from other key technical indicators, signalling a cautious outlook for investors in the non-ferrous metals sector.
Read full news article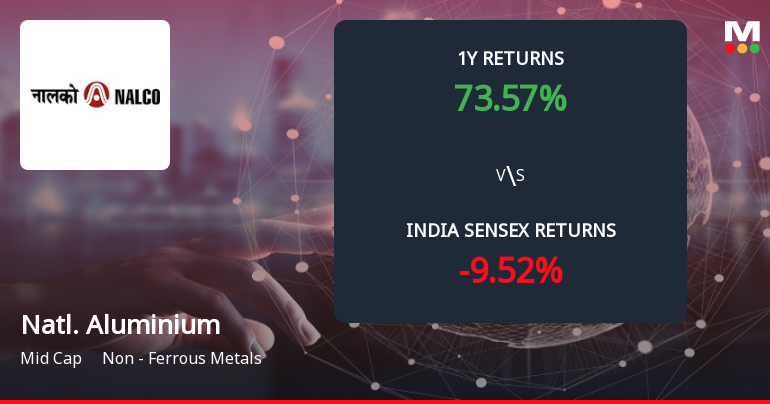
National Aluminium Company Ltd Forms Death Cross Signalling Potential Bearish Trend
National Aluminium Company Ltd (Stock ID: 359296) has recently formed a Death Cross, a significant technical indicator where the 50-day moving average (DMA) crosses below the 200-DMA. This development often signals a shift towards a bearish trend and suggests a deterioration in the stock’s medium to long-term momentum.
Read full news article Announcements
National Aluminium Company Limited - Updates
09-Dec-2019 | Source : NSENational Aluminium Company Limited has informed the Exchange regarding 'Change of name of Registrar & Transfer Agent (RTA) from Karvy Fintech Private Limited to KFin Technologies Private Limited.'.
National Aluminium Company Limited - Change in Director(s)
21-Nov-2019 | Source : NSENational Aluminium Company Limited has informed the Exchange regarding Change in Director(s) of the company.
National Aluminium Company Limited - Reappointment
15-Nov-2019 | Source : NSENational Aluminium Company Limited has informed the Exchange regarding Reappointment of Director of the company. Extension of Tenure of Shri V. Balasubramanyam, Director (Production)
Corporate Actions

No Upcoming Board Meetings

National Aluminium Company Ltd has declared 20% dividend, ex-date: 24 Aug 26

National Aluminium Company Ltd has announced 5:10 stock split, ex-date: 15 Mar 11

National Aluminium Company Ltd has announced 1:1 bonus issue, ex-date: 15 Mar 11

No Rights history available
Key FactorsQuality key factors
Valuation key factors
Technicals key factors
 Technical Indicator Scale: Bearish, Mildly Bearish, Sideways, Mildly Bullish, Bullish Turned Shareholding
Shareholding Snapshot : Jun 2026
Shareholding Compare (%holding)
Promoters
None
Held by 40 Schemes (6.68%)
Held by 721 FIIs (21.99%)
President Of India (51.28%)
Life Insurance Corporation Of India - P & Gs Fund (1.67%)
12.98%
FinancialQuarterly Results Snapshot (Consolidated) - Jun'26 - QoQ
 Compare with Peers
QoQ Growth in quarter ended Jun 2026 is 5.78% vs 5.96% in Mar 2026

QoQ Growth in quarter ended Jun 2026 is 16.30% vs 7.98% in Mar 2026

Half Yearly Results Snapshot (Consolidated) - Sep'25
Growth in half year ended Sep 2025 is 18.11% vs 10.22% in Sep 2024
Growth in half year ended Sep 2025 is 51.70% vs 213.64% in Sep 2024
Nine Monthly Results Snapshot (Consolidated) - Dec'25
YoY Growth in nine months ended Dec 2025 is 11.38% vs 20.38% in Dec 2024
YoY Growth in nine months ended Dec 2025 is 27.30% vs 222.74% in Dec 2024
Annual Results Snapshot (Consolidated) - Mar'26
YoY Growth in year ended Mar 2026 is 6.29% vs 27.67% in Mar 2025
YoY Growth in year ended Mar 2026 is 10.04% vs 164.93% in Mar 2025
 Company CV
About National Aluminium Company Ltd










