
Compare Vedanta with Similar Stocks
Dashboard
High Management Efficiency with a high ROCE of 32.52%
Strong ability to service debt as the company has a low Debt to EBITDA ratio of 0.95 times
Poor long term growth as Operating profit has grown by an annual rate 2.60% of over the last 5 years
Flat results in Mar 26
With ROCE of 37.5, it has a Very Attractive valuation with a 1.9 Enterprise value to Capital Employed
99.99% of Promoter Shares are Pledged
Company is among the highest 1% of companies rated by MarketsMojo across all 4,000 stocks
Stock DNA
Non - Ferrous Metals
INR 102,628 Cr (Large Cap)
7.00
13
10.31%
0.20
30.18%
2.06
Total Returns (Price + Dividend) 
Latest dividend: 3.96 per share ex-dividend date: Mar-27-2026
Risk Adjusted Returns v/s
Returns Beta

News
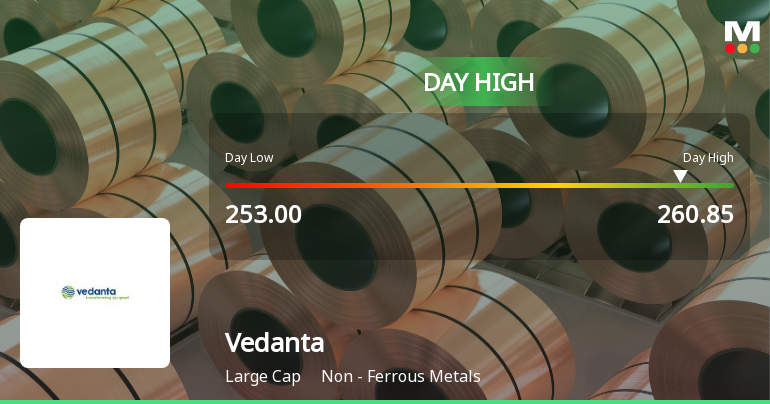
Vedanta Ltd. Rallies 3.04% to Day's High of Rs 260.65 — Outperforms Sector by 1.93 Percentage Points
The Sensex declined 0.63% on 20 Jul 2026, while Vedanta Ltd. surged 3.04%, touching an intraday high of Rs 260.65. This 1.93-percentage-point outperformance over its Non - Ferrous Metals sector peers highlights a stock-specific strength amid a broadly weak market environment.
Read full news article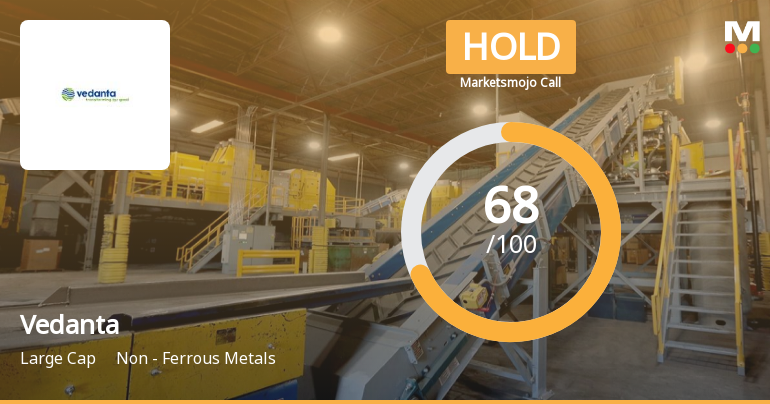
Vedanta Ltd. is Rated Hold by MarketsMOJO
Vedanta Ltd. is rated 'Hold' by MarketsMOJO, with this rating last updated on 29 June 2026. However, the analysis and financial metrics discussed here reflect the stock's current position as of 11 July 2026, providing investors with the latest insights into the company’s performance and outlook.
Read full news article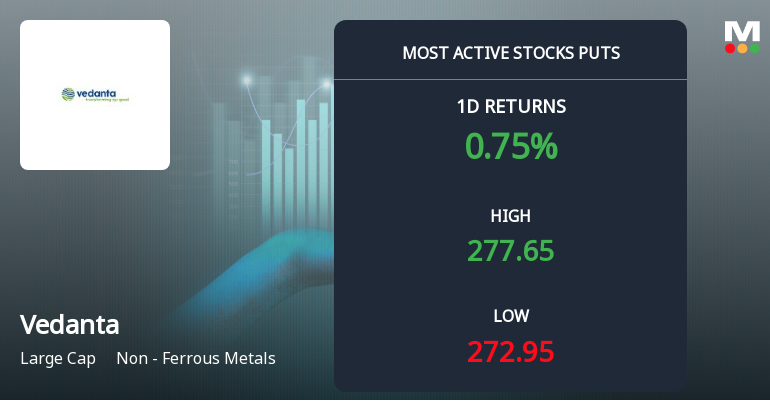
Rs 280 Puts — Slightly Out-of-the-Money — Draw 4,098 Contracts on Vedanta Ltd.
Rs 280 put options on Vedanta Ltd. attracted 4,098 contracts on 8 July 2026, representing a significant surge in activity just above the current stock price of Rs 275.40. This put activity, combined with the stock’s recent price action, suggests a nuanced picture that goes beyond simple bearish bets.
Read full news article Announcements
Vedanta Limited - Shareholders meeting
09-Dec-2019 | Source : NSEVedanta Limited has submitted the Exchange a copy Srutinizers report of Postal Ballot. Further, the company has informed the Exchange regarding voting results.
Vedanta Limited - Committee Meeting Updates
05-Dec-2019 | Source : NSEVedanta Limited has informed the Exchange regarding Outcome of Committee Meeting held on December 04, 2019.
Vedanta Limited - Updates
22-Nov-2019 | Source : NSEVedanta Limited has informed the Exchange regarding 'Compliances under Securities and Exchange Board of India (Depositories and Participants) Regulations, 2018'.
Corporate Actions

No Upcoming Board Meetings

Vedanta Ltd. has declared 1100% dividend, ex-date: 27 Mar 26

Vedanta Ltd. has announced 1:10 stock split, ex-date: 08 Aug 08

Vedanta Ltd. has announced 1:1 bonus issue, ex-date: 08 Aug 08

No Rights history available
Quality key factors
Valuation key factors
Technicals key factors
 Technical Indicator Scale: Bearish, Mildly Bearish, Sideways, Mildly Bullish, Bullish Turned
 Shareholding Snapshot : Mar 2026
Shareholding Compare (%holding)
Promoters
99.9935
Held by 44 Schemes (6.9%)
Held by 861 FIIs (13.93%)
Twin Star Holdings Ltd (40.02%)
Life Insurance Corporation Of India (4.73%)
11.62%
Quarterly Results Snapshot (Consolidated) - Mar'26 - QoQ

QoQ Growth in quarter ended Mar 2026 is 5.31% vs 24.65% in Dec 2025
QoQ Growth in quarter ended Mar 2026 is 17.30% vs 217.58% in Dec 2025
Half Yearly Results Snapshot (Consolidated) - Sep'25

Growth in half year ended Sep 2025 is 5.85% vs 0.99% in Sep 2024
Growth in half year ended Sep 2025 is -37.38% vs 828.59% in Sep 2024
Nine Monthly Results Snapshot (Consolidated) - Dec'25
YoY Growth in nine months ended Dec 2025 is 11.72% vs -16.41% in Dec 2024
YoY Growth in nine months ended Dec 2025 is -7.06% vs 300.87% in Dec 2024
Annual Results Snapshot (Consolidated) - Mar'26
YoY Growth in year ended Mar 2026 is 14.08% vs -52.16% in Mar 2025
YoY Growth in year ended Mar 2026 is 16.03% vs 253.57% in Mar 2025
About Vedanta Ltd.

Company Coordinates


