
Compare Can Fin Homes with Similar Stocks
Dashboard
Strong Long Term Fundamental Strength with an average Return on Equity (ROE) of 17.03%
The company has declared Positive results for the last 3 consecutive quarters
With ROE of 19.9, it has a Fair valuation with a 2.1 Price to Book Value
High Institutional Holdings at 37.98%
Market Beating Performance
Stock DNA
Housing Finance Company
INR 11,348 Cr (Small Cap)
11.00
12
1.53%
6.61
19.88%
2.07
Total Returns (Price + Dividend) 
Latest dividend: 7 per share ex-dividend date: Dec-19-2025
Risk Adjusted Returns v/s
Returns Beta

News
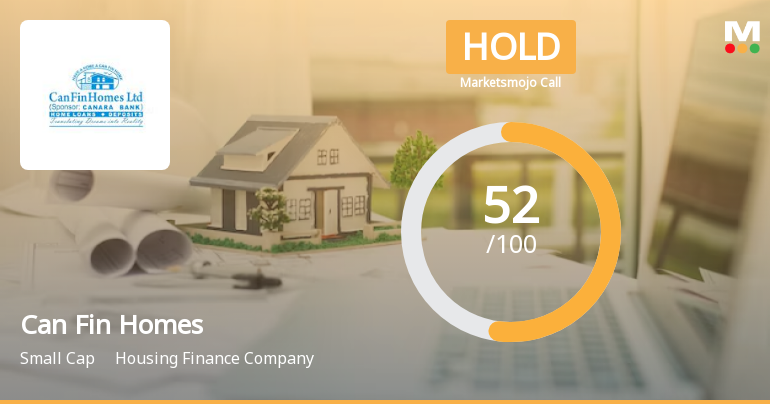
Can Fin Homes Ltd. is Rated Hold by MarketsMOJO
Can Fin Homes Ltd. is rated 'Hold' by MarketsMOJO, with this rating last updated on 11 May 2026. However, the analysis and financial metrics discussed here reflect the stock's current position as of 03 June 2026, providing investors with the latest insights into the company’s performance and outlook.
Read full news article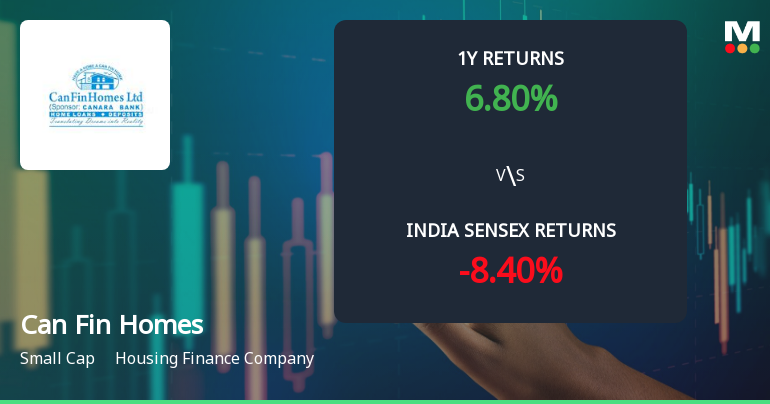
Can Fin Homes Ltd. Technical Momentum Shifts Amid Mixed Market Signals
Can Fin Homes Ltd., a small-cap player in the housing finance sector, has experienced a subtle but notable shift in its technical momentum, moving from a mildly bullish to a mildly bearish stance. This transition is underscored by a complex interplay of technical indicators including MACD, RSI, Bollinger Bands, and moving averages, signalling a nuanced outlook for investors as the stock navigates current market conditions.
Read full news article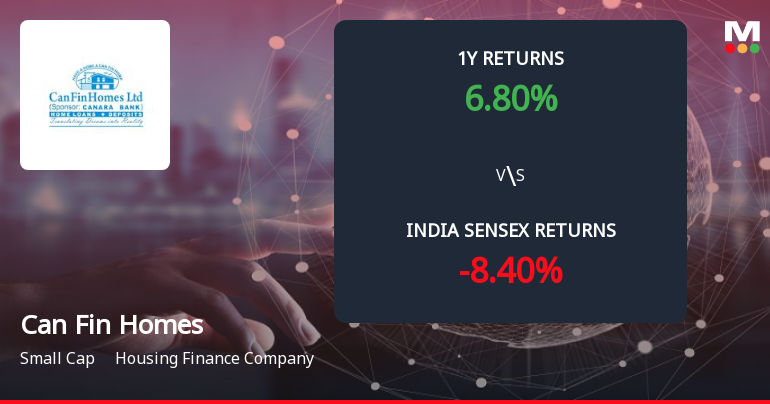
Can Fin Homes Ltd. Forms Death Cross, Signalling Potential Bearish Trend
Can Fin Homes Ltd., a prominent player in the housing finance sector, has recently formed a Death Cross, a technical indicator where the 50-day moving average crosses below the 200-day moving average. This development suggests a potential shift towards a bearish trend, raising concerns about the stock's near-term momentum and long-term strength despite its solid historical performance.
Read full news article Announcements
Can Fin Homes Limited - Analysts/Institutional Investor Meet/Con. Call Updates
05-Dec-2019 | Source : NSECan Fin Homes Limited has informed the Exchange regarding Analysts/Institutional Investor Meet/Con. Call Updates. We wish to inform that Mr. Girish Kousgi, Managing Director and CEO of the Company had meetings with Institutional Investors in Mumbai on Wednesday, 04/12/2019 as per schedule. The list of participants is attached. CNBC TV-18 interviewed Mr. Girish Kousgi at 9:35 a.m. and Bloomberg Quint interviewed Mr. Kousgi at 2:15 p.m. today i.e., on Thursday, 05/12/2019. The subject matter of discussions was mainly on Q2 FY20 results, impact of IND-AS accounting system, performance, asset quality, industry outlook, growth prospects, Capital adequacy, cost of funds, leverage ratio, liquidity, etc., which are covered in detail in the 'Investor Presentation and press release already submitted to the stock exchange(s), post Q2 FY20 results. This intimation is submitted pursuant to Regulation 30 of the SEBI (Listing Obligations and Disclosure Requirements).
Can Fin Homes Limited - Analysts/Institutional Investor Meet/Con. Call Updates
21-Nov-2019 | Source : NSECan Fin Homes Limited has informed the Exchange regarding Analysts/Institutional Investor Meet/Con. Call Updates. We wish to inform that Mr. Girish Kousgi, Managing Director and CEO of the Company met Mr. Navin Agarwal, Managing Director of Motilal Oswal Asset Management Company Limited. Mr.Susmit Patodia and Mr.Manish Sonthalia, Associate Directors and their other team members were also present at the said meeting on 20/11/2019, Wednesday from 2:30 p.m. to 4:15 p.m. at Lower Parel, Mumbai. The subject matter of discussions were mainly on Q2 FY20 results, impact of IND-AS accounting system, performance, asset quality, industry outlook, growth prospects, Capital adequacy, leverage ratio etc., which are covered in detail in the 'Investor Presentation' and press release already submitted to the stock exchange(s), post Q2 FY20 results.
Can Fin Homes Limited - Analysts/Institutional Investor Meet/Con. Call Updates
06-Nov-2019 | Source : NSECan Fin Homes Limited has informed the Exchange regarding Analysts/Institutional Investor Meet/Con. Call Updates. we wish to inform that Shri Girish Kousgi, Managing Director and CEO of the Company was interviewed by E T Now at 10:00 a.m. and Bloomberg Quint at 10:45 a.m. today i.e., Tuesday, 05/11/2019. The Conference Call was held with investors/analysts as per schedule with Shri. Girish Kousgi, Managing Director, Shri. Shreekant M Bhandiwad, Dy. Managing Director, Smt. Shamila M. General Manager and Shri. Prashanth Joishy, AGM and CFO of the Company from 11:30 a.m. to 12:45 p.m. The same was arranged by Investec India and co-ordinated by Shri. Utsav Gogirwar of Investec. The subject matter of discussions was mainly on Q2 FY20 results, impact of IND-AS accounting system, performance, asset quality, industry outlook, growth prospects, Capital adequacy, leverage ratio etc., which are covered in detail in the 'Investor Presentation' and press release already submitted to the stock exchange(s), post Q2 FY20 results.
Corporate Actions

No Upcoming Board Meetings

Can Fin Homes Ltd. has declared 400% dividend, ex-date: 03 Jul 26

Can Fin Homes Ltd. has announced 2:10 stock split, ex-date: 12 Oct 17

No Bonus history available

Can Fin Homes Ltd. has announced 3:10 rights issue, ex-date: 23 Jan 15
Quality key factors
Valuation key factors
Technicals key factors
 Technical Indicator Scale: Bearish, Mildly Bearish, Sideways, Mildly Bullish, Bullish Turned
 Shareholding Snapshot : Mar 2026
Shareholding Compare (%holding)
Non Institution
None
Held by 27 Schemes (16.28%)
Held by 170 FIIs (13.37%)
Canara Bank-mumbai (29.99%)
Chhatisgarh Investments Limited (6.27%)
18.37%
Quarterly Results Snapshot (Standalone) - Mar'26 - YoY

YoY Growth in quarter ended Mar 2026 is 7.52% vs 7.74% in Mar 2025

YoY Growth in quarter ended Mar 2026 is 47.77% vs 11.91% in Mar 2025
Half Yearly Results Snapshot (Standalone) - Sep'25
Growth in half year ended Sep 2025 is 9.31% vs 11.72% in Sep 2024
Growth in half year ended Sep 2025 is 15.61% vs 20.38% in Sep 2024
Nine Monthly Results Snapshot (Standalone) - Dec'25
YoY Growth in nine months ended Dec 2025 is 9.13% vs 10.92% in Dec 2024
YoY Growth in nine months ended Dec 2025 is 18.75% vs 15.06% in Dec 2024
Annual Results Snapshot (Standalone) - Mar'26
YoY Growth in year ended Mar 2026 is 8.70% vs 10.09% in Mar 2025
YoY Growth in year ended Mar 2026 is 26.67% vs 14.18% in Mar 2025
About Can Fin Homes Ltd.

Company Coordinates


