Can Fin Homes

  • Market Cap: Small Cap
  • Industry: Housing Finance Company
  • ISIN: INE477A01020
  • NSEID: CANFINHOME
  • BSEID: 511196
INR
790.30
-3.1 (-0.39%)
BSENSE

Sep 02, 11:06 AM

BSE+NSE Vol: 58.54 k

  • Price Points
  • Score
  • Mojo Parameters
  • Total Return
  • News and Corporate Actions
  • Key factors
  • Shareholding
  • Financials
  • CompanyCV
stock-summaryPrice Point
High/Low

1Day

52 Week

Valuation
Technical
Day's Volume

CASH

58.54 k (-66.20%) Volume

Shareholding (Jun 2026)

FII

13.23%

Held by 171 FIIs

DII

24.53%

Held by 29 DIIs

Promoter

29.99%

Why is Can Fin Homes Ltd. falling/rising?

02-Sep-2026

As of 01-Sep, Can Fin Homes Ltd. is facing a decline in its stock price, currently at 793.60, down 0.23%. Despite strong long-term fundamentals, the stock has decreased by 14.69% year-to-date, with recent performance reflecting a bearish trend and increased selling pressure.

As of 01-Sep, Can Fin Homes Ltd. is experiencing a decline in its stock price, currently at 793.60, which reflects a change of -1.85 (-0.23%). The stock has been on a downward trend, having fallen consecutively for the last two days, resulting in a total decline of -2.45% during this period. Additionally, the stock is trading below its moving averages across various time frames, including the 5-day, 20-day, 50-day, 100-day, and 200-day averages, indicating a bearish trend.<BR><BR>Despite a strong long-term fundamental strength, highlighted by a robust average Return on Equity (ROE) of 16.95% and positive financial results over the last four quarters, the stock's recent performance has not been favorable. Over the past month, it has decreased by -3.15%, while the benchmark Sensex has only fallen by -1.47%. Year-to-date, the stock has seen a significant drop of -14.69%, compared to the Sensex's decline of -9.71%.<BR><BR>Investor participation has increased, with a notable rise in delivery volume, which was up by 94.49% against the 5-day average. However, this has not translated into a positive price movement, as the stock continues to face selling pressure. The high institutional holdings at 37.76% suggest that larger investors are closely monitoring the company's fundamentals, but the current market sentiment appears to be negative, contributing to the stock's decline.

View full answer

Who are in the management team of Can Fin Homes?

01-Sep-2026

The management team of Can Fin Homes includes Suresh S. Iyer (Managing Director & CEO), Ajay Kumar Singh (Deputy Managing Director), and Veena G. Kamath (Company Secretary). The board is chaired by K. Satyanarayana Raju and includes several independent directors.

The management team of Can Fin Homes includes the following key members:<BR><BR>1. **Suresh S. Iyer** - Managing Director & CEO<BR>2. **Ajay Kumar Singh** - Deputy Managing Director<BR>3. **Veena G. Kamath** - Company Secretary & Compliance Officer<BR><BR>Additionally, the Board of Directors features several independent directors, including:<BR><BR>- **Shubhalakshmi Pense**<BR>- **Ajay Kumar**<BR>- **A.S. Bhattacharya**<BR>- **Arvind Narayan**<BR>- **Murali Ramaswami**<BR><BR>The Chairman of the board is **K. Satyanarayana Raju**, who serves in a non-executive capacity. This diverse team brings a range of expertise to the company's leadership.

View full answer

What does Can Fin Homes do?

01-Sep-2026

Can Fin Homes Ltd. is a prominent housing finance institution in India, established in 1987, that focuses on promoting home ownership. As of June 2026, it reported net sales of ₹1,096 Cr and a net profit of ₹268 Cr, with a market cap of ₹10,741 Cr.

Overview:<BR>Can Fin Homes Ltd. is a leading housing finance institution in the small-cap category, focused on promoting home ownership and increasing housing stock across India.<BR><BR>History:<BR>Can Fin Homes Ltd. was incorporated on October 29, 1987, by Canara Bank in collaboration with prominent financial institutions such as HDFC and UTI. The latest quarterly results reported net sales and net profit for June 2026.<BR><BR>Financial Snapshot:<BR>- Most recent Net Sales: 1,096 Cr (Quarterly Results - Jun 2026)<BR>- Most recent Net Profit: 268 Cr (Quarterly Results - Jun 2026)<BR>- Market-cap value: INR 10,741 Cr (Small Cap)<BR><BR>Key Metrics:<BR>- P/E: 9.00<BR>- Industry P/E: 12<BR>- Dividend Yield: 1.84%<BR>- Debt-Equity: 6.36<BR>- Return on Equity: 18.89%<BR>- Price to Book: 1.82<BR><BR>Contact Details:<BR>Address: 29/1 Sir M N Krishna Rao Road, 1st Floor Basavanagudi Bangaluru Karnataka : 560004<BR>Tel: 91-080-41261144/26564259<BR>Email: compsec@canfinhomes.com<BR>Website: http://www.canfinhomes.com

View full answer

Who are the peers of the Can Fin Homes?

01-Sep-2026

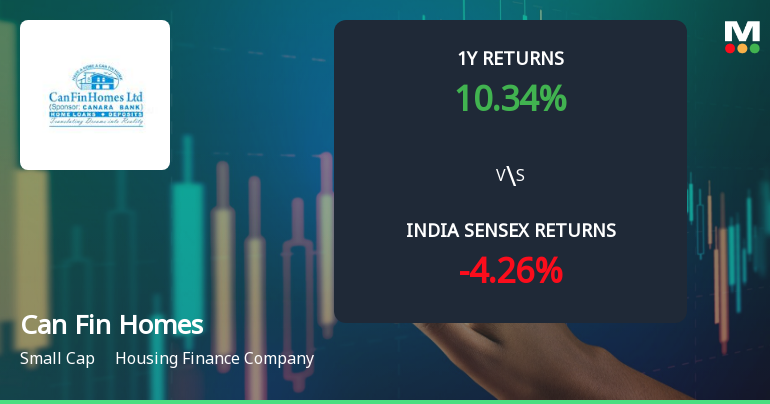
Can Fin Homes' peers include LIC Housing Fin., Aadhar Hsg. Fin., and Home First Finan, among others. In terms of management risk, Can Fin Homes is rated as good, with a 1-year return of 10.74%, lower than Sammaan Capital's 18.23% but higher than INDIA SHELTE FIN's -31.00%.

Peers: The peers of Can Fin Homes are LIC Housing Fin., Aadhar Hsg. Fin., Sammaan Capital, Aptus Value Hou., Home First Finan, Aavas Financiers, INDIA SHELTE FIN, Repco Home Fin, GIC Housing Fin, and SRG Housing.<BR><BR>Quality Snapshot: Excellent management risk is observed at Aptus Value Hou. and Home First Finan, while Good management risk is found at LIC Housing Fin., Aadhar Hsg. Fin., Can Fin Homes, Aavas Financiers, and INDIA SHELTE FIN. Average management risk is present at Sammaan Capital, while Below Average management risk is noted at GIC Housing Fin. and SRG Housing. Growth is Excellent at Home First Finan and INDIA SHELTE FIN, Good at Aptus Value Hou., Average at Aadhar Hsg. Fin., Aavas Financiers, and Can Fin Homes, and Below Average at LIC Housing Fin., Sammaan Capital, and Repco Home Fin. Capital Structure is Excellent at Aadhar Hsg. Fin., Aptus Value Hou., Home First Finan, INDIA SHELTE FIN, and Repco Home Fin, Average at LIC Housing Fin., and Good at Can Fin Homes, while Below Average is seen at GIC Housing Fin. and SRG Housing.<BR><BR>Return Snapshot: The peer with the highest 1-year return is Sammaan Capital at 18.23%, while the lowest is INDIA SHELTE FIN at -31.00%. Can Fin Homes has a 1-year return of 10.74%, which is significantly higher than INDIA SHELTE FIN but lower than Sammaan Capital. Additionally, Aavas Financiers, INDIA SHELTE FIN, GIC Housing Fin, and SRG Housing all have negative six-month returns.

View full answer

How big is Can Fin Homes?

01-Sep-2026

As of 31st August, Can Fin Homes Ltd. has a market capitalization of 10,741.00 Cr, with net sales of 4,292.09 Cr and a net profit of 1,129.70 Cr reported in the latest four quarters. Shareholder's funds are 5,980.40 Cr, and total assets amount to 44,257.54 Cr as of March 2026.

As of 31st August, Can Fin Homes Ltd. has a market capitalization of 10,741.00 Cr, categorizing it as a Small Cap company.<BR><BR>In the latest four quarters, Can Fin Homes reported net sales of 4,292.09 Cr and a net profit of 1,129.70 Cr.<BR><BR>The latest annual period for the balance sheet is March 2026, with shareholder's funds amounting to 5,980.40 Cr and total assets of 44,257.54 Cr.

View full answer

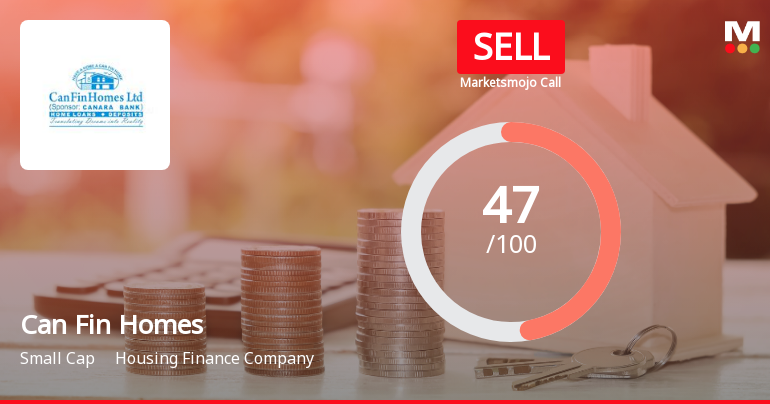
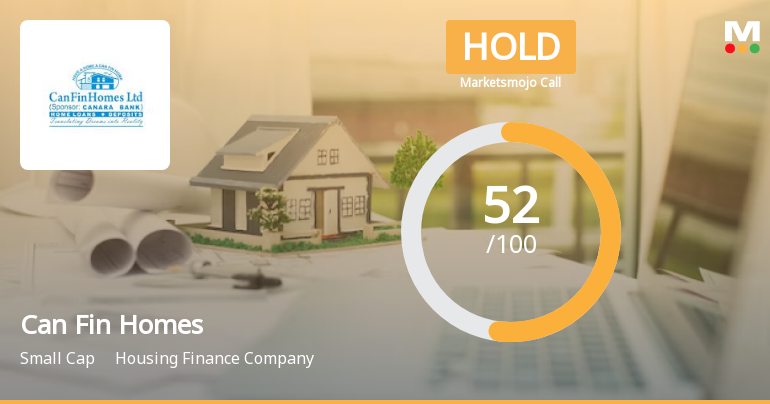
Should I buy, sell or hold Can Fin Homes Ltd.?

01-Sep-2026

Are Can Fin Homes Ltd. latest results good or bad?

19-Jul-2026

Can Fin Homes Ltd.'s latest results show strong year-on-year growth with a 19.63% increase in net profit, but a 22.53% sequential decline raises concerns about sustainability, alongside a high debt-to-equity ratio of 6.36 times. Investors should consider both the positive annual metrics and the negative sequential performance when evaluating the company's health.

Can Fin Homes Ltd.'s latest results present a mixed picture. On one hand, the company reported a net profit of ₹267.82 crore for Q1 FY27, which is a 19.63% increase year-on-year, indicating strong annual growth. Additionally, interest income rose to ₹1,096.15 crore, reflecting a 7.43% increase compared to the same quarter last year, and the net interest margin improved significantly to 31.14%, up 359 basis points year-on-year.<BR><BR>However, there are concerns regarding the sequential performance. The net profit decreased by 22.53% compared to the previous quarter, primarily due to a normalization of tax expenses, which surged from an unusually low rate in the prior quarter. This decline raises questions about the sustainability of earnings growth.<BR><BR>Overall, while the year-on-year growth metrics are encouraging, the sequential decline in profit and the high leverage indicated by a debt-to-equity ratio of 6.36 times are points of concern. Investors may want to weigh these factors carefully when assessing the company's current performance.

View full answer

When is the next results date for Can Fin Homes Ltd.?

10-Jul-2026

The next results date for Can Fin Homes Ltd. is July 18, 2026.

The next results date for Can Fin Homes Ltd. is scheduled for July 18, 2026.

View full answer

Has Can Fin Homes declared dividend?

16-Dec-2025

Yes, Can Fin Homes Ltd. has declared a dividend of 350%, amounting to ₹6 per share, with an ex-date of July 11, 2025. The company has shown strong total returns across various periods, with a total return of 18.62% over the last 3 months.

Can Fin Homes Ltd. has declared a dividend.<BR><BR>Dividend Details:<BR>- Percentage announced: 350%<BR>- Amount per share: 6<BR>- Ex-date: Jul-11-2025<BR><BR>Dividend Yield: 0.66%.<BR><BR>Total Returns by Period:<BR>In the last 3 months, Can Fin Homes achieved a price return of 17.72%, a dividend return of 0.90%, resulting in a total return of 18.62%.<BR><BR>Over the past 6 months, the company recorded a price return of 16.7%, a dividend return of 1.68%, leading to a total return of 18.38%.<BR><BR>For the 1-year period, the price return was 13.85%, with a dividend return of 1.79%, culminating in a total return of 15.64%.<BR><BR>In the 2-year timeframe, Can Fin Homes saw a price return of 16.86%, a dividend return of 3.21%, resulting in a total return of 20.07%.<BR><BR>Over the last 3 years, the company experienced a price return of 74.02%, a dividend return of 4.94%, yielding a total return of 78.96%.<BR><BR>In the 4-year period, the price return was 55.4%, with a dividend return of 5.12%, leading to a total return of 60.52%.<BR><BR>Finally, in the 5-year span, Can Fin Homes achieved a price return of 91.49%, a dividend return of 6.61%, resulting in a total return of 98.1%.<BR><BR>Overall, Can Fin Homes has declared a substantial dividend and demonstrated strong total returns across various periods, indicating a positive performance trend for investors.

View full answer

How has been the historical performance of Can Fin Homes?

25-Nov-2025

Can Fin Homes has shown consistent growth in net sales and profits, with net sales increasing from 1,726.95 Cr in Mar'19 to 3,878.26 Cr in Mar'25, and profit after tax rising to 857.17 Cr. However, rising interest expenses have led to challenges in managing debt, despite improvements in operational efficiency and positive cash flow.

Answer:<BR>The historical performance of Can Fin Homes shows a consistent growth trajectory in net sales and profit metrics over the years.<BR><BR>Breakdown:<BR>Can Fin Homes has demonstrated significant growth in net sales, increasing from 1,726.95 Cr in Mar'19 to 3,878.26 Cr in Mar'25. Total operating income followed a similar upward trend, reaching 3,878.26 Cr in Mar'25 from 1,726.95 Cr in Mar'19. The company’s operating profit (PBDIT) also rose, reaching 1,090.34 Cr in Mar'25, up from 472.47 Cr in Mar'19. However, interest expenses have escalated sharply, from 1,169.10 Cr in Mar'19 to 2,488.16 Cr in Mar'25, leading to a gross profit (PBDT) that remains negative, indicating challenges in managing debt costs. Despite this, profit before tax improved to 1,077.47 Cr in Mar'25 from 469.50 Cr in Mar'19, while profit after tax increased to 857.17 Cr from 296.74 Cr in the same period. The company's total assets grew from 21,009.69 Cr in Mar'20 to 40,897.98 Cr in Mar'25, reflecting a strong asset base, although total debt also rose significantly to 34,863.87 Cr. Cash flow from operating activities turned positive at 933.00 Cr in Mar'25, a notable recovery from previous years of negative cash flow, indicating improved operational efficiency. Overall, Can Fin Homes has shown resilience and growth in its financial performance despite rising interest costs.

View full answer

Is Can Fin Homes overvalued or undervalued?

24-Nov-2025

As of November 21, 2025, Can Fin Homes is considered overvalued with a PE ratio of 12.83, compared to peers like HUDCO and LIC Housing Finance, despite outperforming the Sensex year-to-date.

As of 21 November 2025, Can Fin Homes has moved from a valuation grade of very attractive to very expensive. The company is currently considered overvalued based on its financial ratios. The PE ratio stands at 12.83, while the Price to Book Value is 2.16, and the EV to EBITDA ratio is 12.77. <BR><BR>In comparison with peers, HUDCO has a higher PE ratio of 16.44, and Piramal Finance shows an even more elevated PE at 61.32, indicating that Can Fin Homes is priced significantly higher than some of its competitors. Notably, LIC Housing Finance, which is rated as attractive, has a much lower PE of 5.45, suggesting that Can Fin Homes may not justify its current valuation. Additionally, while Can Fin Homes has outperformed the Sensex year-to-date with a return of 17.30% compared to the Sensex's 9.08%, the overall valuation metrics indicate that the stock is overvalued in the current market environment.

View full answer

Is Can Fin Homes technically bullish or bearish?

15-Oct-2025

As of 14 October 2025, Can Fin Homes shows a mildly bullish trend, supported by daily moving averages and a bullish weekly MACD, despite mixed signals from longer-term indicators.

As of 14 October 2025, the technical trend for Can Fin Homes has changed from bullish to mildly bullish. The weekly MACD remains bullish, while the monthly MACD is mildly bearish, indicating mixed signals across time frames. The daily moving averages are bullish, supporting a positive short-term outlook. Bollinger Bands show a mildly bullish stance on the weekly chart and bullish on the monthly chart. However, the KST is mildly bearish on the weekly and bearish on the monthly, which adds caution. The Dow Theory indicates a mildly bullish trend on the monthly basis but no trend on the weekly. Overall, the current technical stance is mildly bullish, driven primarily by the daily moving averages and the weekly MACD, despite some bearish signals in the longer-term indicators.

View full answer

Who are the top shareholders of the Can Fin Homes?

06-Jun-2025

The top shareholders of Can Fin Homes include Canara Bank with a 29.99% stake, Chhatisgarh Investments Limited at 6.27%, and individual investors holding 19.52%. Additionally, 77 mutual fund schemes own 15.09%, while 141 foreign institutional investors hold 12.14%, with no pledged promoter holdings reported.

The top shareholders of Can Fin Homes include Canara Bank, which holds the highest promoter stake at 29.99%. Other significant shareholders are Chhatisgarh Investments Limited, with a 6.27% stake, and individual investors collectively holding 19.52%. Additionally, the company has 77 mutual fund schemes holding 15.09% and 141 foreign institutional investors (FIIs) with a combined holding of 12.14%. There are no pledged promoter holdings reported.

View full answer
iScoreScore
Click here to find our call on this stock
Strong Sell
Sell
Hold
Buy
Strong Buy

Dashboard

Icon
Unrated Stock - No Analysis Available
stock-summaryMojo Parameters

Mojo Parameters

Loading Valuation Snapshot...

Stock DNA

stock-summary
Industry

Housing Finance Company

stock-summary
Market cap

INR 10,523 Cr (Small Cap)

stock-summary
P/E

9.00

stock-summary
Industry P/E

12

stock-summary
Dividend Yield

1.89%

stock-summary
Debt Equity

6.36

stock-summary
Return on Equity

18.89%

stock-summary
Price to Book

1.77

Revenue and Profits:
Net Sales:
1,096 Cr
(Quarterly Results - Jun 2026)
Net Profit:
268 Cr
stock-summaryTotal Returns
Total Returns (Price + Dividend) stock-summary
Dividend Yield (1.89%)
TimePeriod
Price Return
Dividend Return
Total Return
3 Months
-4.7%
0.98%
-3.72%
6 Months
-3.79%
0.97%
-2.82%
1 Year
4.65%
2.01%
6.66%
2 Years
-10.18%
2.97%
-7.21%
3 Years
3.99%
4.29%
8.28%
4 Years
24.28%
7.05%
31.33%
5 Years
34.77%
6.04%
40.81%

Latest dividend: 8 per share ex-dividend date: Jul-03-2026

Risk Adjusted Returns v/s stock-summary
Returns Beta
Icon
Beta has not been calculated since enough price history is not available
stock-summaryNews & Corporate Actions

News

Announcements stock-summary

Can Fin Homes Limited - Analysts/Institutional Investor Meet/Con. Call Updates

05-Dec-2019 | Source : NSE

Can Fin Homes Limited has informed the Exchange regarding Analysts/Institutional Investor Meet/Con. Call Updates. We wish to inform that Mr. Girish Kousgi, Managing Director and CEO of the Company had meetings with Institutional Investors in Mumbai on Wednesday, 04/12/2019 as per schedule. The list of participants is attached. CNBC TV-18 interviewed Mr. Girish Kousgi at 9:35 a.m. and Bloomberg Quint interviewed Mr. Kousgi at 2:15 p.m. today i.e., on Thursday, 05/12/2019. The subject matter of discussions was mainly on Q2 FY20 results, impact of IND-AS accounting system, performance, asset quality, industry outlook, growth prospects, Capital adequacy, cost of funds, leverage ratio, liquidity, etc., which are covered in detail in the 'Investor Presentation and press release already submitted to the stock exchange(s), post Q2 FY20 results. This intimation is submitted pursuant to Regulation 30 of the SEBI (Listing Obligations and Disclosure Requirements).

Can Fin Homes Limited - Analysts/Institutional Investor Meet/Con. Call Updates

21-Nov-2019 | Source : NSE

Can Fin Homes Limited has informed the Exchange regarding Analysts/Institutional Investor Meet/Con. Call Updates. We wish to inform that Mr. Girish Kousgi, Managing Director and CEO of the Company met Mr. Navin Agarwal, Managing Director of Motilal Oswal Asset Management Company Limited. Mr.Susmit Patodia and Mr.Manish Sonthalia, Associate Directors and their other team members were also present at the said meeting on 20/11/2019, Wednesday from 2:30 p.m. to 4:15 p.m. at Lower Parel, Mumbai. The subject matter of discussions were mainly on Q2 FY20 results, impact of IND-AS accounting system, performance, asset quality, industry outlook, growth prospects, Capital adequacy, leverage ratio etc., which are covered in detail in the 'Investor Presentation' and press release already submitted to the stock exchange(s), post Q2 FY20 results.

Can Fin Homes Limited - Analysts/Institutional Investor Meet/Con. Call Updates

06-Nov-2019 | Source : NSE

Can Fin Homes Limited has informed the Exchange regarding Analysts/Institutional Investor Meet/Con. Call Updates. we wish to inform that Shri Girish Kousgi, Managing Director and CEO of the Company was interviewed by E T Now at 10:00 a.m. and Bloomberg Quint at 10:45 a.m. today i.e., Tuesday, 05/11/2019. The Conference Call was held with investors/analysts as per schedule with Shri. Girish Kousgi, Managing Director, Shri. Shreekant M Bhandiwad, Dy. Managing Director, Smt. Shamila M. General Manager and Shri. Prashanth Joishy, AGM and CFO of the Company from 11:30 a.m. to 12:45 p.m. The same was arranged by Investec India and co-ordinated by Shri. Utsav Gogirwar of Investec. The subject matter of discussions was mainly on Q2 FY20 results, impact of IND-AS accounting system, performance, asset quality, industry outlook, growth prospects, Capital adequacy, leverage ratio etc., which are covered in detail in the 'Investor Presentation' and press release already submitted to the stock exchange(s), post Q2 FY20 results.

Corporate Actions stock-summary

stock-summary
BOARD MEETING

No Upcoming Board Meetings

stock-summary
DIVIDEND

Can Fin Homes Ltd. has declared 400% dividend, ex-date: 03 Jul 26

stock-summary
SPLITS

Can Fin Homes Ltd. has announced 2:10 stock split, ex-date: 12 Oct 17

stock-summary
BONUS

No Bonus history available

stock-summary
RIGHTS

Can Fin Homes Ltd. has announced 3:10 rights issue, ex-date: 23 Jan 15

stock-summaryKey Factors

Quality key factors stock-summary

Factor
Value
Sales Growth (5y)
17.13%
EBIT Growth (5y)
17.18%
Net Debt to Equity (avg)
6.36
Institutional Holding
37.76%
ROE (avg)
16.95%

Valuation key factors

Factor
Value
P/E Ratio
9
Industry P/E
12
Price to Book Value
1.77
EV to EBIT
11.73
EV to EBITDA
11.68
EV to Capital Employed
1.11
EV to Sales
10.76
PEG Ratio
0.33
Dividend Yield
1.89%
ROCE (Latest)
8.93%
ROE (Latest)
18.89%

Technicals key factors

Indicator
Weekly
Monthly
MACD
Bearish
Mildly Bearish
RSI
No Signal
No Signal
Bollinger Bands
Bearish
Bearish
Moving Averages
Bearish (Daily)
KST
Bearish
Mildly Bearish
Dow Theory
Mildly Bearish
No Trend
OBV
No Trend
No Trend
stock-summary Technical Indicator Scale: Bearish, Mildly Bearish, Sideways, Mildly Bullish, Bullish  Turned 
stock-summaryShareholding
Shareholding Snapshot : Jun 2026stock-summary
Shareholding Compare (%holding) stock-summary
Majority shareholders

Non Institution

Pledged Promoter Holdings

None

Mutual Funds

Held by 29 Schemes (16.54%)

FIIs

Held by 171 FIIs (13.23%)

Promoter with highest holding

Canara Bank-mumbai (29.99%)

Highest Public shareholder

Chhatisgarh Investments Limited (6.27%)

Individual Investors Holdings

18.72%

stock-summaryFinancial
[
  {
    "link": "quarterly",
    "btn_text": "All Quarterly Results",
    "header": "Quarterly Results Snapshot (Standalone) - Jun'26 - YoY",
    "rhs": [
      {
        "prefix": "Net Sales ",
        "suffix": "YoY Growth in quarter ended Jun 2026 is 7.43% vs 9.59% in Jun 2025",
        "dir": -1
      },
      {
        "prefix": "Standalone Net Profit ",
        "suffix": "YoY Growth in quarter ended Jun 2026 is 19.63% vs 12.14% in Jun 2025",
        "dir": 1
      }
    ],
    "table": {
      "header": [
        "Jun'26",
        "Jun'25",
        "Change(%)"
      ],
      "body": [
        {
          "field": "Net Sales",
          "val1": "1,096.15",
          "val2": "1,020.33",
          "chgp": "7.43%",
          "chgp_class": "positive"
        },
        {
          "field": "Operating Profit (PBDIT) excl Other Income",
          "val1": "1,000.63",
          "val2": "929.33",
          "chgp": "7.67%",
          "chgp_class": "positive"
        },
        {
          "field": "Interest",
          "val1": "659.46",
          "val2": "648.31",
          "chgp": "1.72%",
          "chgp_class": "negative"
        },
        {
          "field": "Exceptional Items",
          "val1": "0.00",
          "val2": "0.00",
          "chgp": "",
          "chgp_class": "neutral"
        },
        {
          "field": "Standalone Net Profit",
          "val1": "267.82",
          "val2": "223.87",
          "chgp": "19.63%",
          "chgp_class": "positive"
        },
        {
          "field": "Operating Profit Margin (Excl OI)",
          "val1": "91.29%",
          "val2": "91.08%",
          "chgp": "0.21%",
          "chgp_class": "positive"
        }
      ]
    }
  },
  {
    "link": "half-yearly",
    "btn_text": "All Half Yearly Results",
    "header": "Half Yearly Results Snapshot (Standalone) - Sep'25",
    "rhs": [
      {
        "prefix": "Net Sales ",
        "suffix": " Growth in half year ended Sep 2025 is 9.31% vs 11.72% in Sep 2024",
        "dir": -1
      },
      {
        "prefix": "Standalone Net Profit ",
        "suffix": " Growth in half year ended Sep 2025 is 15.61% vs 20.38% in Sep 2024",
        "dir": -1
      }
    ],
    "table": {
      "header": [
        "Sep'25",
        "Sep'24",
        "Change(%)"
      ],
      "body": [
        {
          "field": "Net Sales",
          "val1": "2,069.78",
          "val2": "1,893.56",
          "chgp": "9.31%",
          "chgp_class": "positive"
        },
        {
          "field": "Operating Profit (PBDIT) excl Other Income",
          "val1": "616.56",
          "val2": "534.35",
          "chgp": "15.39%",
          "chgp_class": "positive"
        },
        {
          "field": "Interest",
          "val1": "1,286.89",
          "val2": "1,218.22",
          "chgp": "5.64%",
          "chgp_class": "negative"
        },
        {
          "field": "Exceptional Items",
          "val1": "0.00",
          "val2": "0.00",
          "chgp": "",
          "chgp_class": "neutral"
        },
        {
          "field": "Standalone Net Profit",
          "val1": "475.30",
          "val2": "411.13",
          "chgp": "15.61%",
          "chgp_class": "positive"
        },
        {
          "field": "Operating Profit Margin (Excl OI)",
          "val1": "29.79%",
          "val2": "28.22%",
          "chgp": "1.57%",
          "chgp_class": "positive"
        }
      ]
    }
  },
  {
    "link": "nine-monthly",
    "btn_text": "All Nine Monthly Results",
    "header": "Nine Monthly Results Snapshot (Standalone) - Dec'25",
    "rhs": [
      {
        "prefix": "Net Sales ",
        "suffix": "YoY Growth in nine months ended Dec 2025 is 9.13% vs 10.92% in Dec 2024",
        "dir": -1
      },
      {
        "prefix": "Standalone Net Profit ",
        "suffix": "YoY Growth in nine months ended Dec 2025 is 18.75% vs 15.06% in Dec 2024",
        "dir": 1
      }
    ],
    "table": {
      "header": [
        "Dec'25",
        "Dec'24",
        "Change(%)"
      ],
      "body": [
        {
          "field": "Net Sales",
          "val1": "3,142.62",
          "val2": "2,879.67",
          "chgp": "9.13%",
          "chgp_class": "positive"
        },
        {
          "field": "Operating Profit (PBDIT) excl Other Income",
          "val1": "1,604.13",
          "val2": "1,442.36",
          "chgp": "11.22%",
          "chgp_class": "positive"
        },
        {
          "field": "Interest",
          "val1": "1,929.07",
          "val2": "1,853.81",
          "chgp": "4.06%",
          "chgp_class": "negative"
        },
        {
          "field": "Exceptional Items",
          "val1": "0.00",
          "val2": "0.00",
          "chgp": "",
          "chgp_class": "neutral"
        },
        {
          "field": "Standalone Net Profit",
          "val1": "740.08",
          "val2": "623.25",
          "chgp": "18.75%",
          "chgp_class": "positive"
        },
        {
          "field": "Operating Profit Margin (Excl OI)",
          "val1": "51.04%",
          "val2": "50.09%",
          "chgp": "0.95%",
          "chgp_class": "positive"
        }
      ]
    }
  },
  {
    "link": "annual",
    "btn_text": "All Annual Results",
    "header": "Annual Results Snapshot (Standalone) - Mar'26",
    "rhs": [
      {
        "prefix": "Net Sales ",
        "suffix": "YoY Growth in year ended Mar 2026 is 8.70% vs 10.09% in Mar 2025",
        "dir": -1
      },
      {
        "prefix": "Standalone Net Profit ",
        "suffix": "YoY Growth in year ended Mar 2026 is 26.67% vs 14.18% in Mar 2025",
        "dir": 1
      }
    ],
    "table": {
      "header": [
        "Mar'26",
        "Mar'25",
        "Change(%)"
      ],
      "body": [
        {
          "field": "Net Sales",
          "val1": "4,216.27",
          "val2": "3,878.64",
          "chgp": "8.70%",
          "chgp_class": "positive"
        },
        {
          "field": "Operating Profit (PBDIT) excl Other Income",
          "val1": "1,318.28",
          "val2": "1,089.36",
          "chgp": "21.01%",
          "chgp_class": "positive"
        },
        {
          "field": "Interest",
          "val1": "2,563.23",
          "val2": "2,488.16",
          "chgp": "3.02%",
          "chgp_class": "negative"
        },
        {
          "field": "Exceptional Items",
          "val1": "0.00",
          "val2": "0.00",
          "chgp": "",
          "chgp_class": "neutral"
        },
        {
          "field": "Standalone Net Profit",
          "val1": "1,085.75",
          "val2": "857.17",
          "chgp": "26.67%",
          "chgp_class": "positive"
        },
        {
          "field": "Operating Profit Margin (Excl OI)",
          "val1": "31.27%",
          "val2": "28.09%",
          "chgp": "3.18%",
          "chgp_class": "positive"
        }
      ]
    }
  }
]

Quarterly Results Snapshot (Standalone) - Jun'26 - YoYstock-summary

Jun'26
Jun'25
Change(%)
Net Sales
1,096.15
1,020.33
7.43%
Operating Profit (PBDIT) excl Other Income
1,000.63
929.33
7.67%
Interest
659.46
648.31
1.72%
Exceptional Items
0.00
0.00
Standalone Net Profit
267.82
223.87
19.63%
Operating Profit Margin (Excl OI)
91.29%
91.08%
0.21%
Values in Rs Cr.
Direction Arrows
Net Sales

YoY Growth in quarter ended Jun 2026 is 7.43% vs 9.59% in Jun 2025

Direction Arrows
Standalone Net Profit

YoY Growth in quarter ended Jun 2026 is 19.63% vs 12.14% in Jun 2025

Half Yearly Results Snapshot (Standalone) - Sep'25stock-summary

Sep'25
Sep'24
Change(%)
Net Sales
2,069.78
1,893.56
9.31%
Operating Profit (PBDIT) excl Other Income
616.56
534.35
15.39%
Interest
1,286.89
1,218.22
5.64%
Exceptional Items
0.00
0.00
Standalone Net Profit
475.30
411.13
15.61%
Operating Profit Margin (Excl OI)
29.79%
28.22%
1.57%
Values in Rs Cr.
Direction Arrows
Net Sales

Growth in half year ended Sep 2025 is 9.31% vs 11.72% in Sep 2024

Direction Arrows
Standalone Net Profit

Growth in half year ended Sep 2025 is 15.61% vs 20.38% in Sep 2024

Nine Monthly Results Snapshot (Standalone) - Dec'25stock-summary

Dec'25
Dec'24
Change(%)
Net Sales
3,142.62
2,879.67
9.13%
Operating Profit (PBDIT) excl Other Income
1,604.13
1,442.36
11.22%
Interest
1,929.07
1,853.81
4.06%
Exceptional Items
0.00
0.00
Standalone Net Profit
740.08
623.25
18.75%
Operating Profit Margin (Excl OI)
51.04%
50.09%
0.95%
Values in Rs Cr.
Direction Arrows
Net Sales

YoY Growth in nine months ended Dec 2025 is 9.13% vs 10.92% in Dec 2024

Direction Arrows
Standalone Net Profit

YoY Growth in nine months ended Dec 2025 is 18.75% vs 15.06% in Dec 2024

Annual Results Snapshot (Standalone) - Mar'26stock-summary

Mar'26
Mar'25
Change(%)
Net Sales
4,216.27
3,878.64
8.70%
Operating Profit (PBDIT) excl Other Income
1,318.28
1,089.36
21.01%
Interest
2,563.23
2,488.16
3.02%
Exceptional Items
0.00
0.00
Standalone Net Profit
1,085.75
857.17
26.67%
Operating Profit Margin (Excl OI)
31.27%
28.09%
3.18%
Values in Rs Cr.
Direction Arrows
Net Sales

YoY Growth in year ended Mar 2026 is 8.70% vs 10.09% in Mar 2025

Direction Arrows
Standalone Net Profit

YoY Growth in year ended Mar 2026 is 26.67% vs 14.18% in Mar 2025

stock-summaryCompany CV
About Can Fin Homes Ltd. stock-summary
stock-summary
Can Fin Homes Ltd.
Small Cap
Housing Finance Company
Can Fin Homes Limited (CFHL) was incorporated on October 29, 1987 by Canara Bank in association with reputed financial institutions including HDFC and UTI. The company was set up in Bangalore with the mission of promoting Home Ownership and increasing Housing Stock all over the country. CFHL is a leading housing finance institution approved by National Housing Bank (NHB), the apex authority of housing in the country.
Company Coordinates stock-summary
Company Details
29/1 Sir M N Krishna Rao Road, 1st Floor Basavanagudi Bangaluru Karnataka : 560004
stock-summary
Tel: 91-080-41261144/26564259
stock-summary
compsec@canfinhomes.com
Registrar Details
Canbank Computer Services Ltd , R & T Center , J. P. Royale, 1st Floor, No.218,2nd Main Sampige Road, Malleshwaram, Bangalore