DIC India

  • Market Cap: Micro Cap
  • Industry: Other Chemical products
  • ISIN: INE303A01010
  • NSEID: DICIND
  • BSEID: 500089
INR
494.00
4.6 (0.94%)
BSENSE

Dec 10

BSE+NSE Vol: 87

  • Price Points
  • Score
  • Mojo Parameters
  • Total Return
  • News and Corporate Actions
  • Key factors
  • Shareholding
  • Financials
  • CompanyCV
stock-summaryPrice Point
High/Low

1Day

52 Week

Valuation
Technical
Day's Volume

CASH

87 (-52.82%) Volume

Shareholding (Sep 2025)

FII

0.00%

Held by 0 FIIs

DII

0.00%

Held by 0 DIIs

Promoter

71.75%

Who are in the management team of DIC India?

06-Jun-2025

As of December 2022, the management team of DIC India includes Manish Bhatia (Managing Director & CEO), Paul Koek, Masahiro Kikuchi, Raghav Shukla (Company Secretary), and several independent directors: Pritha Dutt, Prabal Kumar Sarkar, Rajeev Anand, Ryohei Kohashi, and Adnan Wajhat Ahmad. Each member contributes diverse skills to the company's governance and strategy.

As of December 2022, the management team of DIC India includes:<BR><BR>1. Manish Bhatia - Managing Director & CEO<BR>2. Paul Koek - Director<BR>3. Masahiro Kikuchi - Director<BR>4. Raghav Shukla - Company Secretary & Compliance Officer<BR>5. Pritha Dutt - Independent Director<BR>6. Prabal Kumar Sarkar - Independent Director<BR>7. Rajeev Anand - Independent Director<BR>8. Ryohei Kohashi - Director<BR>9. Adnan Wajhat Ahmad - Independent Director<BR><BR>Each member brings a unique set of skills and experience to the company, contributing to its governance and strategic direction.

Read More

Has DIC India declared dividend?

06-Jun-2025

Yes, DIC India Ltd has declared a 40% dividend, amounting to ₹4 per share, with an ex-date of March 18, 2025. The company has demonstrated strong total returns over various periods, particularly in the long term.

DIC India Ltd has declared a 40% dividend.<BR><BR>Dividend Details:<BR>- Percentage announced: 40%<BR>- Amount per share: 4<BR>- Ex-date: 18 Mar 25<BR><BR>Dividend Yield: 0.6%<BR><BR>Total Returns by Period:<BR>In the last 6 months, the price return was -8.63%, the dividend return was 0.59%, resulting in a total return of -8.04%.<BR><BR>Over the past year, the price return was 37.46%, the dividend return was 0.86%, leading to a total return of 38.32%.<BR><BR>In the 2-year period, the price return was 61.12%, the dividend return was 0.94%, culminating in a total return of 62.06%.<BR><BR>For the 3-year period, the price return was 79.14%, the dividend return was 1.67%, which resulted in a total return of 80.81%.<BR><BR>In the last 4 years, the price return was 25.58%, the dividend return was 1.72%, giving a total return of 27.3%.<BR><BR>Over the past 5 years, the price return was 87.47%, the dividend return was 4.27%, resulting in a total return of 91.74%.<BR><BR>Overall, DIC India Ltd has declared a significant dividend and has shown strong total returns over various periods, particularly in the longer term, indicating a positive performance trend for investors.

Read More

Who are the peers of the DIC India?

03-Jun-2025

DIC India's peers include Solar Industries, Linde India, and PCBL Chemical, among others. DIC India has average management risk and below average growth, with a 1-year return of 35.74%, higher than Linde India's -15.34% but lower than Refex Industries' 269.64%.

Peers: The peers of DIC India are Solar Industries, Linde India, PCBL Chemical, Refex Industries, Prem. Explosives, Keltech Energies, Beezaasan Exp., Natl. Oxygen, Hilltone Softwar, and Gagan Gases.<BR><BR>Quality Snapshot: Excellent management risk is observed at Solar Industries, while Good management risk is found at Linde India, PCBL Chemical, Beezaasan Exp., and Gagan Gases. Average management risk is present at Refex Industries, Prem. Explosives, DIC India, Keltech Energies, and the rest. Below Average management risk is noted at Natl. Oxygen and Hilltone Softwar. In terms of Growth, Excellent growth is seen at Solar Industries, PCBL Chemical, and Refex Industries, while Good growth is observed at Prem. Explosives, Beezaasan Exp., and the rest. Average growth is noted at Keltech Energies, while DIC India shows Below Average growth. <BR><BR>Return Snapshot: Refex Industries has the highest 1-year return at 269.64%, while Linde India has the lowest at -15.34%. DIC India's 1-year return is 35.74%, which is significantly higher than Linde India's but lower than Refex Industries. Additionally, Natl. Oxygen and Hilltone Softwar have negative six-month returns.

Read More

What does DIC India do?

17-Jul-2025

DIC India Ltd, a micro-cap company in the Other Chemical products industry, reported net sales of ₹2,093 Cr and a net profit of ₹26 Cr for Q1 2025. Founded in 1947 and formerly known as Coates India, it has a market cap of ₹568 Cr and key metrics including a P/E of 32.00 and a dividend yield of 0.65%.

Overview:<BR>DIC India Ltd operates in the Other Chemical products industry and is categorized as a Micro Cap company.<BR><BR>History:<BR>DIC India Limited was incorporated as a Public Limited Company on April 02, 1947, originally known as Coates India Limited. The company changed its name in August 2004. The latest quarterly results reported net sales and profit for the period ending March 2025.<BR><BR>Financial Snapshot:<BR>- Net Sales: 2,093 Cr (Quarterly Results - Mar 2025)<BR>- Net Profit: 26 Cr (Quarterly Results - Mar 2025)<BR>- Market-cap: INR 568 Cr (Micro Cap)<BR><BR>Key Metrics:<BR>- P/E: 32.00<BR>- Industry P/E: 47<BR>- Dividend Yield: 0.65%<BR>- Debt Equity: -0.09<BR>- Return on Equity: 4.19%<BR>- Price to Book: 1.35<BR><BR>Contact Details:<BR>- Address: Transport Depot Road, Kolkata, West Bengal: 700088<BR>- Tel: 91-33-24496591-95<BR>- Email: investors@dic.co.in<BR>- Website: http://www.dic.co.in

Read More

Who are the top shareholders of the DIC India?

17-Jul-2025

The top shareholder of DIC India is Dic Asia Pacific Pte Ltd, owning 71.75% of the shares, followed by public shareholder Hitesh Ramji Javeri with 3.57%. Individual investors hold a combined 23.4%, with no mutual funds or foreign institutional investors currently involved.

The top shareholders of DIC India include Dic Asia Pacific Pte Ltd, which holds a significant 71.75% of the shares. The highest public shareholder is Hitesh Ramji Javeri, with a holding of 3.57%. Additionally, individual investors collectively hold 23.4% of the company's shares. There are currently no mutual funds or foreign institutional investors (FIIs) holding shares in DIC India.

Read More

How big is DIC India?

24-Jul-2025

As of 24th July, DIC India Ltd has a market capitalization of 570.00 Cr, classified as a Micro Cap, with recent net sales of 889.44 Cr and a net profit of 17.93 Cr over the latest four quarters. Data for shareholder's funds and total assets is unavailable.

As of 24th July, <BR><BR>Market Cap: DIC India Ltd has a market capitalization of 570.00 Cr and is classified as a Micro Cap.<BR><BR>Recent Quarterly Performance: The sum of Net Sales for the latest 4 quarters is 889.44 Cr, while the sum of Net Profit for the same period is 17.93 Cr.<BR><BR>Balance Sheet Snapshot: The reporting period is the latest annual period. However, data for Shareholder's Funds and Total Assets is unavailable.

Read More

When is the next results date for DIC India?

08-Aug-2025

DIC India will announce its results on 13 August 2025.

DIC India will declare its results on 13 August 2025.

Read More

Are DIC India latest results good or bad?

14-Aug-2025

DIC India's latest results are mixed; while Profit Before Tax increased by 27.6% and net sales grew by 7.90%, Profit After Tax fell by 32.94% year-on-year, raising concerns about financial health. Analysts have a cautious outlook, with some recommending a 'Sell' call.

DIC India's latest results present a mixed picture. On one hand, the company has shown a notable improvement in its Profit Before Tax (PBT), which increased by 27.6% compared to the average of the previous four quarters, reaching Rs 4.67 crore. Additionally, there was a positive trend in net sales, which grew by 7.90% quarter-over-quarter, indicating some recovery in operational performance.<BR><BR>On the other hand, the Profit After Tax (PAT) for the latest six months has significantly declined by 32.94% year-on-year, totaling Rs 6.95 crore. This decline raises concerns about the company's overall financial health and sustainability.<BR><BR>Overall, while there are positive indicators in terms of sales and PBT growth, the substantial drop in PAT and the cautious outlook from analysts, including a 'Sell' call from MarketsMOJO, suggest that the results may not be entirely favorable. Investors should weigh these factors carefully when considering the company's performance.

Read More

Is DIC India technically bullish or bearish?

22-Sep-2025

As of September 19, 2025, DIC India is in a bearish trend with moderate strength, supported by bearish signals from key indicators like the MACD, Bollinger Bands, and moving averages, and has significantly underperformed against the Sensex over the past month and year.

As of 19 September 2025, the technical trend for DIC India has changed from mildly bearish to bearish. The current stance is bearish with a moderate strength. Key indicators driving this assessment include the weekly MACD and Bollinger Bands both signaling bearish conditions, along with daily moving averages also indicating a bearish trend. The KST and Dow Theory on a weekly basis are bearish, further supporting the negative outlook. The stock has underperformed significantly against the Sensex over multiple time frames, particularly in the last month and year.

Read More

How has been the historical performance of DIC India?

13-Nov-2025

DIC India exhibited steady growth in net sales and profitability from 2007 to 2009, with net sales rising from 444.09 crore in 2007 to 504.35 crore in 2009, and profit after tax increasing from 14.24 crore to 22.07 crore. The company also improved its operating profit margin from 7.5% to 9.37% during this period.

Answer:<BR>The historical performance of DIC India shows a steady growth in net sales and profitability over the years from 2007 to 2009.<BR><BR>Breakdown:<BR>In the fiscal year ending December 2007, DIC India reported net sales of 444.09 crore, which increased to 515.11 crore in December 2008, before slightly declining to 504.35 crore in December 2009. The total operating income followed a similar trend, rising from 444.09 crore in 2007 to 517.30 crore in 2008, and then decreasing to 509.18 crore in 2009. The company's operating profit (PBDIT) also improved from 38.14 crore in 2007 to 41.91 crore in 2008, and further to 48.02 crore in 2009, indicating a positive trend in operational efficiency. Profit before tax rose from 22.23 crore in 2007 to 27.72 crore in 2008, and reached 34.05 crore in 2009. Consequently, profit after tax increased from 14.24 crore in 2007 to 18.15 crore in 2008, and further to 22.07 crore in 2009. The earnings per share (EPS) reflected this growth, rising from 20.69 in 2007 to 24.05 in 2009. The operating profit margin also improved from 7.5% in 2007 to 9.37% in 2009, while the profit after tax margin increased from 3.21% to 4.33% over the same period. Cash flow from operating activities showed a significant recovery in 2009, reaching 34.90 crore after a negative cash flow in 2008, contributing to a net cash inflow of 10.50 crore by the end of 2009. Overall, DIC India demonstrated a solid performance trajectory with increasing profitability and operational efficiency from 2007 to 2009.

Read More

Should I buy, sell or hold DIC India?

15-Nov-2025

Is DIC India overvalued or undervalued?

17-Nov-2025

As of November 14, 2025, DIC India is fairly valued with a PE ratio of 24.11, significantly lower than its expensive peers like Solar Industries and Gujarat Fluoroch, despite a year-to-date underperformance of -23.35% compared to the Sensex's 8.22%.

As of 14 November 2025, the valuation grade for DIC India has moved from expensive to fair. The company appears to be fairly valued at this time, with a PE ratio of 24.11, an EV to EBITDA ratio of 11.54, and a PEG ratio of 0.32, indicating potential growth relative to its price. <BR><BR>In comparison to its peers, DIC India’s PE ratio is significantly lower than that of Solar Industries, which has a PE of 95.17, and Gujarat Fluoroch, at 57.32, both of which are considered very expensive. In contrast, Godrej Industries, which is rated attractive, has a PE of 37.36. Despite recent underperformance against the Sensex, with a year-to-date return of -23.35% compared to the Sensex's 8.22%, the current valuation suggests that DIC India is positioned more favorably than many of its peers.

Read More

Why is DIC India falling/rising?

08-Dec-2025

As of 08-Dec, DIC India Ltd's stock price is Rs 495.00, down 3.32%, significantly underperforming the Sensex. The stock is near its 52-week low and shows a bearish trend, with declining investor interest and sector challenges contributing to its poor performance.

As of 08-Dec, DIC India Ltd's stock price is falling, currently at Rs 495.00, which reflects a decrease of Rs 17.00 or 3.32%. The stock has underperformed significantly compared to the benchmark Sensex, with a 1-week decline of 5.71% versus the Sensex's drop of only 0.63%. Over the past month, the stock has decreased by 2.37%, while the Sensex has increased by 2.27%. Year-to-date, DIC India has seen a substantial decline of 25.70%, contrasting sharply with the Sensex's gain of 8.91%.<BR><BR>Today's performance indicates that the stock is close to its 52-week low, just 1.61% away from Rs 487.05. The stock has also touched an intraday low of Rs 495, and it is trading below all key moving averages (5-day, 20-day, 50-day, 100-day, and 200-day), suggesting a bearish trend. Additionally, the chemicals sector has experienced a decline of 2.39%, which may be impacting DIC India's performance. <BR><BR>Investor participation appears to be waning, as evidenced by a significant drop in delivery volume, which fell by 67.21% compared to the 5-day average. This lack of interest from investors could further contribute to the stock's downward pressure. Overall, the combination of poor performance relative to the market, declining investor participation, and sector-wide challenges are key factors driving DIC India's stock price down.

Read More
iScoreScore
Click here to find our call on this stock
Strong Sell
Sell
Hold
Buy
Strong Buy

MarketsMojo — Loved in India, Now Global

The power of Mojo is now in 29 countries. Explore global equities with the same cutting-edge features you love.

Dashboard
1

Poor long term growth as Net Sales has grown by an annual rate of 6.67% over the last 5 years

 
2

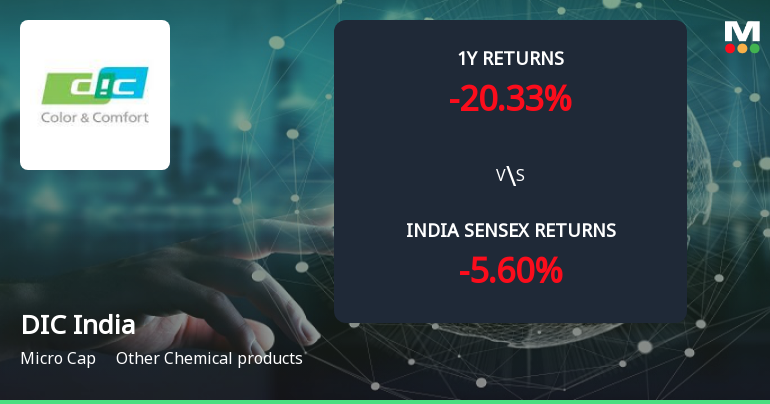
Below par performance in long term as well as near term

stock-summaryMojo Parameters
Mojo Parameters
Loading Valuation Snapshot...
Stock DNA
stock-summary
Industry

Other Chemical products

stock-summary
Market cap

INR 452 Cr (Micro Cap)

stock-summary
P/E

23.00

stock-summary
Industry P/E

40

stock-summary
Dividend Yield

0.82%

stock-summary
Debt Equity

-0.09

stock-summary
Return on Equity

4.65%

stock-summary
Price to Book

1.07

Revenue and Profits:
Net Sales:
222 Cr
(Quarterly Results - Sep 2025)
Net Profit:
6 Cr
stock-summaryTotal Returns
Total Returns (Price + Dividend) stock-summary
Dividend Yield (0.82%)
TimePeriod
Price Return
Dividend Return
Total Return
3 Months
-14.36%
0%
-14.36%
6 Months
-24.58%
0%
-24.58%
1 Year
-27.63%
0.54%
-27.09%
2 Years
-0.56%
0.80%
0.24%
3 Years
26.93%
1.62%
28.55%
4 Years
20.17%
2.03%
22.2%
5 Years
26.65%
3.55%
30.2%

Latest dividend: 4 per share ex-dividend date: Mar-18-2025

Risk Adjusted Returns v/s stock-summary
Returns Beta
Icon
Beta has not been calculated since enough price history is not available
stock-summaryNews & Corporate Actions
News

Why is DIC India falling/rising?

Recent Price Movement and Market Context

DIC India’s share price has been on a downward trajectory over the past week, falling by 2.25%, which notably exceeds the Sensex’s modest decline of 0.55% during the same period. The stock’s underperformance is more pronounced over longer time frames, with a one-month loss of 3.53% contrasting with the Sensex’s gain of 1.74%. Year-to-date, the stock has declined sharply by 26.58%, while the Sensex has advanced by 8.35%. Over the last year, DIC India’s shares have dropped 28.28%, whereas the benchmark index has risen 3.87%. These figures highlight a sustained period of relative weakness for the company’s stock compared to the broader market.

Technical Indicators and Trading Patterns

On the day in question,...

Read More
Announcements stock-summary

DIC India Limited - Updates

09-Oct-2019 | Source : NSE

DIC India Limited has informed the Exchange regarding 'Announcement under Regulation 30 of SEBI (LODR), 2015- Status update on land sale- Disclosure made on June 12, 2017, December 13,2017and January 30, 2019 etc. on sale of land at Mumbai.

Reply to Clarification Sought

05-Sep-2019 | Source : NSE

DICIND: The Exchange had sought clarification from DIC India Limited with respect to announcement dated 30-Aug-2019, regarding Credit Rating. On basis of above the Company was required to clarify following: 1. In case of downward rating, the disclosure may include reasons published by rating agency for such downward rating.2. Whether notified the Exchange within prescribed time and not later than 24 hours.The response of the Company is attached.

Clarification

04-Sep-2019 | Source : NSE

DICIND: The Exchange has sought clarification from DIC India Limited with respect to announcement dated 30-Aug-2019, regarding Credit Rating. On basis of above the Company is required to clarify following: 1. In case of downward rating, the disclosure may include reasons published by rating agency for such downward rating.2. Whether notified the Exchange within prescribed time and not later than 24 hours.The response of the Company is awaited.

Corporate Actions stock-summary
stock-summary
BOARD MEETING

No Upcoming Board Meetings

stock-summary
DIVIDEND

DIC India Ltd has declared 40% dividend, ex-date: 18 Mar 25

stock-summary
SPLITS

No Splits history available

stock-summary
BONUS

No Bonus history available

stock-summary
RIGHTS

DIC India Ltd has announced 1:3 rights issue, ex-date: 19 Oct 07

stock-summaryKey Factors
Quality key factors stock-summary
Factor
Value
Sales Growth (5y)
6.67%
EBIT Growth (5y)
22.93%
EBIT to Interest (avg)
5.23
Debt to EBITDA (avg)
0.59
Net Debt to Equity (avg)
-0.09
Sales to Capital Employed (avg)
1.93
Tax Ratio
25.37%
Dividend Payout Ratio
18.79%
Pledged Shares
0
Institutional Holding
0.00%
ROCE (avg)
2.05%
ROE (avg)
2.77%
Valuation key factors
Factor
Value
P/E Ratio
23
Industry P/E
40
Price to Book Value
1.07
EV to EBIT
21.48
EV to EBITDA
11.01
EV to Capital Employed
1.08
EV to Sales
0.47
PEG Ratio
0.31
Dividend Yield
0.82%
ROCE (Latest)
3.84%
ROE (Latest)
4.65%
Technicals key factors
Indicator
Weekly
Monthly
MACD
Mildly Bullish
Mildly Bearish
RSI
Bullish
Bullish
Bollinger Bands
Bearish
Bearish
Moving Averages
Bearish (Daily)
KST
Mildly Bullish
Mildly Bearish
Dow Theory
Mildly Bearish
Mildly Bullish
OBV
Mildly Bearish
Mildly Bearish
stock-summary Technical Indicator Scale: Bearish, Mildly Bearish, Sideways, Mildly Bullish, Bullish  Turned 
stock-summaryShareholding
Shareholding Snapshot : Sep 2025stock-summary
Shareholding Compare (%holding) stock-summary
Majority shareholders

Promoters

Pledged Promoter Holdings

None

Mutual Funds

Held by 0 Schemes

FIIs

Held by 0 FIIs

Promoter with highest holding

Dic Asia Pacific Pte Ltd (71.75%)

Highest Public shareholder

Hitesh Ramji Javeri (3.57%)

Individual Investors Holdings

23.29%

stock-summaryFinancial
[
  {
    "link": "quarterly",
    "btn_text": "All Quarterly Results",
    "header": "Quarterly Results Snapshot (Standalone) - Sep'25 - QoQ",
    "rhs": [
      {
        "prefix": "Net Sales ",
        "suffix": "QoQ Growth in quarter ended Sep 2025 is -1.58% vs 7.90% in Jun 2025",
        "dir": -1
      },
      {
        "prefix": "Standalone Net Profit ",
        "suffix": "QoQ Growth in quarter ended Sep 2025 is 34.63% vs 68.34% in Jun 2025",
        "dir": -1
      }
    ],
    "table": {
      "header": [
        "Sep'25",
        "Jun'25",
        "Change(%)"
      ],
      "body": [
        {
          "field": "Net Sales",
          "val1": "222.23",
          "val2": "225.80",
          "chgp": "-1.58%",
          "chgp_class": "negative"
        },
        {
          "field": "Operating Profit (PBDIT) excl Other Income",
          "val1": "11.74",
          "val2": "9.36",
          "chgp": "25.43%",
          "chgp_class": "positive"
        },
        {
          "field": "Interest",
          "val1": "0.33",
          "val2": "0.29",
          "chgp": "13.79%",
          "chgp_class": "negative"
        },
        {
          "field": "Exceptional Items",
          "val1": "0.00",
          "val2": "0.00",
          "chgp": "",
          "chgp_class": "neutral"
        },
        {
          "field": "Standalone Net Profit",
          "val1": "5.87",
          "val2": "4.36",
          "chgp": "34.63%",
          "chgp_class": "positive"
        },
        {
          "field": "Operating Profit Margin (Excl OI)",
          "val1": "5.28%",
          "val2": "4.15%",
          "chgp": "1.13%",
          "chgp_class": "positive"
        }
      ]
    }
  },
  {
    "link": "half-yearly",
    "btn_text": "All Half Yearly Results",
    "header": "Half Yearly Results Snapshot (Standalone) - Jun'25",
    "rhs": [
      {
        "prefix": "Net Sales ",
        "suffix": " Growth in half year ended Jun 2025 is -0.92% vs 8.21% in Jun 2024",
        "dir": -1
      },
      {
        "prefix": "Standalone Net Profit ",
        "suffix": " Growth in half year ended Jun 2025 is -33.24% vs 727.11% in Jun 2024",
        "dir": -1
      }
    ],
    "table": {
      "header": [
        "Jun'25",
        "Jun'24",
        "Change(%)"
      ],
      "body": [
        {
          "field": "Net Sales",
          "val1": "435.06",
          "val2": "439.10",
          "chgp": "-0.92%",
          "chgp_class": "negative"
        },
        {
          "field": "Operating Profit (PBDIT) excl Other Income",
          "val1": "16.15",
          "val2": "19.73",
          "chgp": "-18.14%",
          "chgp_class": "negative"
        },
        {
          "field": "Interest",
          "val1": "0.62",
          "val2": "0.68",
          "chgp": "-8.82%",
          "chgp_class": "positive"
        },
        {
          "field": "Exceptional Items",
          "val1": "0.00",
          "val2": "0.05",
          "chgp": "-100.00%",
          "chgp_class": "negative"
        },
        {
          "field": "Standalone Net Profit",
          "val1": "6.95",
          "val2": "10.41",
          "chgp": "-33.24%",
          "chgp_class": "negative"
        },
        {
          "field": "Operating Profit Margin (Excl OI)",
          "val1": "3.71%",
          "val2": "4.49%",
          "chgp": "-0.78%",
          "chgp_class": "negative"
        }
      ]
    }
  },
  {
    "link": "nine-monthly",
    "btn_text": "All Nine Monthly Results",
    "header": "Nine Monthly Results Snapshot (Standalone) - Sep'25",
    "rhs": [
      {
        "prefix": "Net Sales ",
        "suffix": "YoY Growth in nine months ended Sep 2025 is -0.27% vs 6.02% in Sep 2024",
        "dir": -1
      },
      {
        "prefix": "Standalone Net Profit ",
        "suffix": "YoY Growth in nine months ended Sep 2025 is 3.47% vs 179.99% in Sep 2024",
        "dir": -1
      }
    ],
    "table": {
      "header": [
        "Sep'25",
        "Sep'24",
        "Change(%)"
      ],
      "body": [
        {
          "field": "Net Sales",
          "val1": "657.29",
          "val2": "659.06",
          "chgp": "-0.27%",
          "chgp_class": "negative"
        },
        {
          "field": "Operating Profit (PBDIT) excl Other Income",
          "val1": "27.89",
          "val2": "27.02",
          "chgp": "3.22%",
          "chgp_class": "positive"
        },
        {
          "field": "Interest",
          "val1": "0.95",
          "val2": "1.02",
          "chgp": "-6.86%",
          "chgp_class": "positive"
        },
        {
          "field": "Exceptional Items",
          "val1": "0.00",
          "val2": "0.05",
          "chgp": "-100.00%",
          "chgp_class": "negative"
        },
        {
          "field": "Standalone Net Profit",
          "val1": "12.82",
          "val2": "12.39",
          "chgp": "3.47%",
          "chgp_class": "positive"
        },
        {
          "field": "Operating Profit Margin (Excl OI)",
          "val1": "4.23%",
          "val2": "4.08%",
          "chgp": "0.15%",
          "chgp_class": "positive"
        }
      ]
    }
  },
  {
    "link": "annual",
    "btn_text": "All Annual Results",
    "header": "Annual Results Snapshot (Standalone) - Dec'24",
    "rhs": [
      {
        "prefix": "Net Sales ",
        "suffix": "YoY Growth in year ended Dec 2024 is 6.26% vs -4.86% in Dec 2023",
        "dir": 1
      },
      {
        "prefix": "Standalone Net Profit ",
        "suffix": "YoY Growth in year ended Dec 2024 is 186.16% vs -155.34% in Dec 2023",
        "dir": 1
      }
    ],
    "table": {
      "header": [
        "Dec'24",
        "Dec'23",
        "Change(%)"
      ],
      "body": [
        {
          "field": "Net Sales",
          "val1": "877.52",
          "val2": "825.85",
          "chgp": "6.26%",
          "chgp_class": "positive"
        },
        {
          "field": "Operating Profit (PBDIT) excl Other Income",
          "val1": "36.42",
          "val2": "9.73",
          "chgp": "274.31%",
          "chgp_class": "positive"
        },
        {
          "field": "Interest",
          "val1": "1.76",
          "val2": "4.15",
          "chgp": "-57.59%",
          "chgp_class": "positive"
        },
        {
          "field": "Exceptional Items",
          "val1": "0.75",
          "val2": "-23.79",
          "chgp": "103.15%",
          "chgp_class": "positive"
        },
        {
          "field": "Standalone Net Profit",
          "val1": "19.54",
          "val2": "-22.68",
          "chgp": "186.16%",
          "chgp_class": "positive"
        },
        {
          "field": "Operating Profit Margin (Excl OI)",
          "val1": "4.15%",
          "val2": "1.18%",
          "chgp": "2.97%",
          "chgp_class": "positive"
        }
      ]
    }
  }
]
Quarterly Results Snapshot (Standalone) - Sep'25 - QoQstock-summary
Sep'25
Jun'25
Change(%)
Net Sales
222.23
225.80
-1.58%
Operating Profit (PBDIT) excl Other Income
11.74
9.36
25.43%
Interest
0.33
0.29
13.79%
Exceptional Items
0.00
0.00
Standalone Net Profit
5.87
4.36
34.63%
Operating Profit Margin (Excl OI)
5.28%
4.15%
1.13%
Values in Rs Cr.
Direction Arrows
Net Sales

QoQ Growth in quarter ended Sep 2025 is -1.58% vs 7.90% in Jun 2025

Direction Arrows
Standalone Net Profit

QoQ Growth in quarter ended Sep 2025 is 34.63% vs 68.34% in Jun 2025

Half Yearly Results Snapshot (Standalone) - Jun'25stock-summary
Jun'25
Jun'24
Change(%)
Net Sales
435.06
439.10
-0.92%
Operating Profit (PBDIT) excl Other Income
16.15
19.73
-18.14%
Interest
0.62
0.68
-8.82%
Exceptional Items
0.00
0.05
-100.00%
Standalone Net Profit
6.95
10.41
-33.24%
Operating Profit Margin (Excl OI)
3.71%
4.49%
-0.78%
Values in Rs Cr.
Direction Arrows
Net Sales

Growth in half year ended Jun 2025 is -0.92% vs 8.21% in Jun 2024

Direction Arrows
Standalone Net Profit

Growth in half year ended Jun 2025 is -33.24% vs 727.11% in Jun 2024

Nine Monthly Results Snapshot (Standalone) - Sep'25stock-summary
Sep'25
Sep'24
Change(%)
Net Sales
657.29
659.06
-0.27%
Operating Profit (PBDIT) excl Other Income
27.89
27.02
3.22%
Interest
0.95
1.02
-6.86%
Exceptional Items
0.00
0.05
-100.00%
Standalone Net Profit
12.82
12.39
3.47%
Operating Profit Margin (Excl OI)
4.23%
4.08%
0.15%
Values in Rs Cr.
Direction Arrows
Net Sales

YoY Growth in nine months ended Sep 2025 is -0.27% vs 6.02% in Sep 2024

Direction Arrows
Standalone Net Profit

YoY Growth in nine months ended Sep 2025 is 3.47% vs 179.99% in Sep 2024

Annual Results Snapshot (Standalone) - Dec'24stock-summary
Dec'24
Dec'23
Change(%)
Net Sales
877.52
825.85
6.26%
Operating Profit (PBDIT) excl Other Income
36.42
9.73
274.31%
Interest
1.76
4.15
-57.59%
Exceptional Items
0.75
-23.79
103.15%
Standalone Net Profit
19.54
-22.68
186.16%
Operating Profit Margin (Excl OI)
4.15%
1.18%
2.97%
Values in Rs Cr.
Direction Arrows
Net Sales

YoY Growth in year ended Dec 2024 is 6.26% vs -4.86% in Dec 2023

Direction Arrows
Standalone Net Profit

YoY Growth in year ended Dec 2024 is 186.16% vs -155.34% in Dec 2023

stock-summaryCompany CV
About DIC India Ltd stock-summary
stock-summary
DIC India Ltd
Micro Cap
Other Chemical products
DIC India Limited (formerly known as Coates India Limited) was incorporated as a Public Limited Company on April 02, 1947 by the Founder, Manish Bhatia. The name of the Company was changed in August 2004 from Coates of India Limited to DIC India Limited.The Company is a subsidiary of DIC Asia Pacific Pte Limited, Singapore and the Ultimate Holding Company is DIC Corporation, Japan.
Company Coordinates stock-summary
Company Details
Transport Depot Road , Kolkata West Bengal : 700088
stock-summary
Tel: 91-33-24496591-95
stock-summary
investors@dic.co.in
Registrar Details
CB Management Services Pvt Ltd , (Formerly Choksey Bhargava & Co Ltd) , P-22, P 22 Bondel Road, Calcutta