Aarti Industries

  • Market Cap: Small Cap
  • Industry: Specialty Chemicals
  • ISIN: INE769A01020
  • NSEID: AARTIIND
  • BSEID: 524208
INR
509.50
4.3 (0.85%)
BSENSE

Sep 03, 09:38 AM

BSE+NSE Vol: 95.85 k

  • Price Points
  • Score
  • Mojo Parameters
  • Total Return
  • News and Corporate Actions
  • Key factors
  • Shareholding
  • Financials
  • CompanyCV
stock-summaryPrice Point
High/Low

1Day

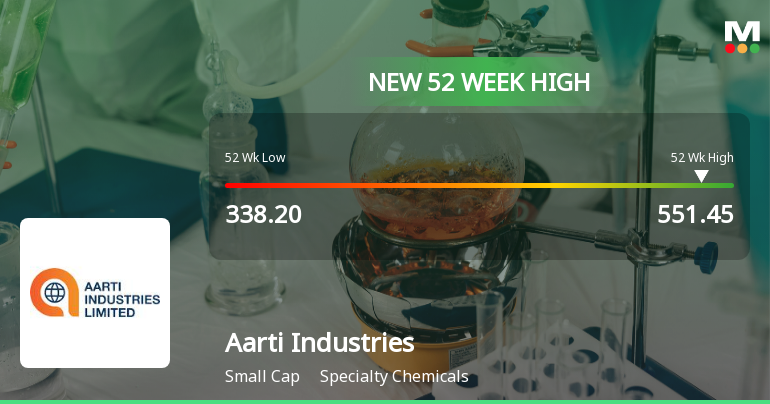
52 Week

Valuation
Technical
Day's Volume

CASH

95.85 k (24.41%) Volume

Shareholding (Jun 2026)

FII

6.99%

Held by 149 FIIs

DII

21.13%

Held by 36 DIIs

Promoter

41.82%

Why is Aarti Industries Ltd. falling/rising?

03-Sep-2026

As of 02-Sep, Aarti Industries Ltd. is facing a stock price decline to Rs 505.45, down 3.66%, due to underperformance relative to its sector, reduced trading volume, and concerns over its high Debt to EBITDA ratio and poor long-term growth prospects.

As of 02-Sep, Aarti Industries Ltd. is experiencing a decline in its stock price, currently at Rs 505.45, which reflects a change of -19.2 or -3.66%. This drop can be attributed to several factors highlighted in the recent performance data. <BR><BR>Today, the stock underperformed its sector by -3.07%, indicating weaker performance relative to its peers. It reached an intraday low of Rs 503.15, marking a decrease of -4.1%. Additionally, the trading volume has shown a decline, with delivery volume dropping by -12.77% compared to the 5-day average, suggesting reduced investor interest and participation.<BR><BR>While the company has reported positive financial results over the past quarters, including a net profit growth of 13.14% and a significant increase in profits over the last year, these positive indicators are overshadowed by concerns regarding its high Debt to EBITDA ratio of 4.26 times, which signals a low ability to service debt. Furthermore, the stock's long-term growth prospects appear poor, with operating profit having decreased at an annual rate of -0.34% over the last five years.<BR><BR>In summary, despite some positive financial metrics and high institutional holdings, the current decline in Aarti Industries Ltd.'s stock price is primarily driven by underperformance in today's trading, reduced investor participation, and concerns over debt management and long-term growth potential.

View full answer

Who are in the management team of Aarti Industries?

01-Sep-2026

The management team of Aarti Industries includes key members such as Rajendra V Gogri (Chairman & Managing Director), Rashesh C Gogri (Vice Chairman & Managing Director), and several whole-time and independent directors, totaling 21 members who guide the company's strategic direction and operations.

The management team of Aarti Industries includes the following key members:<BR><BR>1. **Chandrakant V Gogri** - Chairman Emeritus<BR>2. **Rajendra V Gogri** - Chairman & Managing Director<BR>3. **Parimal H Desai** - Whole-time Director<BR>4. **Manoj M Chheda** - Whole-time Director<BR>5. **Rashesh C Gogri** - Vice Chairman & Managing Director<BR>6. **Hetal Gogri Gala** - Non-Executive Director<BR>7. **Kirit R Mehta** - Whole-time Director<BR>8. **Renil R Gogri** - Whole-time Director<BR>9. **Ganapati D Yadav** - Non-Executive & Independent Director<BR>10. **Priti Savla** - Non-Executive & Independent Director<BR>11. **Vinay Gopal Nayak** - Non-Executive & Independent Director<BR>12. **Lalitkumar Shantaram Naik** - Non-Executive & Independent Director<BR>13. **Raj Sarraf** - Company Secretary & Compliance Officer<BR>14. **Narendra Jagannath Salvi** - Non-Executive Director<BR>15. **K V S Shyam Sunder** - Independent Director<BR>16. **P A Sethi** - Independent Director<BR>17. **Bhavesh R Vora** - Independent Director<BR>18. **Natasha Kersi TreasurYWALA** - Independent Director<BR>19. **Aniruddha Pandit** - Independent Director<BR>20. **Shekhar Khanolkar** - Independent Director<BR>21. **Ajay Kumar Gupta** - Executive Director<BR><BR>This diverse team plays a crucial role in steering the company's strategic direction and operations.

View full answer

What does Aarti Industries do?

01-Sep-2026

Aarti Industries Limited is a small-cap Indian multinational specializing in benzene-based specialty chemicals, with recent net sales of ₹2,387 Cr and a net profit of ₹155 Cr as of June 2026. The company has a market cap of ₹19,480 Cr and key financial metrics include a P/E ratio of 36.00 and a debt-equity ratio of 0.73.

Overview: <BR>Aarti Industries Limited is a competitive and highly integrated benzene-based specialty chemical company operating in the small-cap market.<BR><BR>History: <BR>The company was incorporated in an unspecified year and has evolved into an Indian multinational. The latest quarterly results reported net sales and profit for June 2026.<BR><BR>Financial Snapshot: <BR>Most recent Net Sales: 2,387 Cr (Quarterly Results - Jun 2026) <BR>Most recent Net Profit: 155 Cr (Quarterly Results - Jun 2026) <BR>Market-cap value: INR 19,480 Cr (Small Cap)<BR><BR>Key Metrics: <BR>P/E: 36.00 <BR>Industry P/E: 43 <BR>Dividend Yield: 0.00% <BR>Debt-Equity: 0.73 <BR>Return on Equity: 6.92% <BR>Price-to-Book: 3.29 <BR><BR>Contact Details: <BR>Address: Plot Nos 801 801/23, GIDC Estate Phase III VAPI Gujarat : 396195 <BR>Phone: 91-2638-55976666/25918195 <BR>Email: investorrelations@aartigroup.com <BR>Website: http://www.aartigroup.com

View full answer

Who are the peers of the Aarti Industries?

01-Sep-2026

Aarti Industries' peers include Gujarat Fluoroch, Navin Fluoro International, Himadri Special, Deepak Nitrite, Aether Industries, Atul, BASF India, Fine Organic, Anupam Rasayan, and Vinati Organics. Aarti Industries has average management risk and below average growth and capital structure, with a 1-year return of 39.38%.

Peers: The peers of Aarti Industries are Gujarat Fluoroch, Navin Fluo.Intl., Himadri Special, Deepak Nitrite, Aether Industri., Atul, BASF India, Fine Organic, Anupam Rasayan, and Vinati Organics.<BR><BR>Quality Snapshot: Excellent management risk is observed at Navin Fluo.Intl., Himadri Special, Atul, and BASF India, while Good management risk is found at Gujarat Fluoroch, Deepak Nitrite, Aether Industri., and Vinati Organics. Average management risk is attributed to Aarti Industries, while Anupam Rasayan has Below Average management risk. Growth is Excellent for Navin Fluo.Intl. and Himadri Special, while Aether Industri. shows Average growth, and Deepak Nitrite has Below Average growth. Aarti Industries also has Below Average growth, while Atul, BASF India, and Anupam Rasayan show Below Average growth, with Fine Organic at Average growth. Capital Structure is Excellent for Navin Fluo.Intl., Himadri Special, Deepak Nitrite, Aether Industri., Atul, BASF India, and Fine Organic, while Aarti Industries has Below Average capital structure, and Anupam Rasayan shows Average capital structure.<BR><BR>Return Snapshot: The peer with the highest 1-year return is Aether Industri. at 130.07%, while the lowest is BASF India at -17.84%. Aarti Industries has a 1-year return of 39.38%, which is significantly higher than BASF India but lower than Aether Industri. Additionally, Atul, BASF India, and Vinati Organics have negative six-month returns.

View full answer

How big is Aarti Industries?

01-Sep-2026

As of 31st August, Aarti Industries Ltd. has a market capitalization of 19,480.00 Cr, with recent net sales of 9,010.00 Cr and a net profit of 531.00 Cr.

As of 31st August, Aarti Industries Ltd. has a market capitalization of 19,480.00 Cr, classifying it as a Small Cap company.<BR><BR>In the latest four quarters, Aarti Industries reported Net Sales of 9,010.00 Cr and a Net Profit of 531.00 Cr.<BR><BR>The latest annual period for the balance sheet is March 2026, with Shareholder's Funds amounting to 5,955.17 Cr and Total Assets of 12,995.82 Cr.

View full answer

Should I buy, sell or hold Aarti Industries Ltd.?

12-Aug-2026

Are Aarti Industries Ltd. latest results good or bad?

31-Jul-2026

Aarti Industries Ltd. reported strong Q1 FY27 results, with a net profit increase of 260.47% and revenue growth of 42.51%. However, concerns about long-term profitability and moderate leverage suggest investors should remain cautious despite the positive short-term performance.

Aarti Industries Ltd. has reported strong results for Q1 FY27, indicating a positive performance overall. The company achieved a net profit of ₹155 crore, which represents a remarkable year-on-year increase of 260.47%. Additionally, revenue grew by 42.51% year-on-year, reaching ₹2,387 crore, and operating margins improved to 16.0%, up from 12.66% in the same quarter last year.<BR><BR>The stock market responded favorably to these results, with shares trading at ₹491.70, reflecting a gain of 2.32% on the day of the announcement. Over the past six months, the stock has outperformed the Sensex significantly, gaining 32.30% compared to the Sensex's decline of 5.20%.<BR><BR>However, while the quarterly results are impressive, there are underlying concerns. The company has faced challenges in terms of long-term profitability, with a five-year operating profit growth rate of -1.63% and a return on equity (ROE) of just 12.03%, which is below the benchmark for high-quality chemical manufacturers. The balance sheet shows moderate leverage, with a debt-to-EBITDA ratio of 3.10 times, which could limit financial flexibility.<BR><BR>In summary, the latest results are good in the short term, showcasing a strong recovery and operational improvements, but investors should remain cautious due to the company's historical performance and ongoing structural challenges.

View full answer

When is the next results date for Aarti Industries Ltd.?

21-Jul-2026

The next results date for Aarti Industries Ltd. is 30 July 2026.

The next results date for Aarti Industries Ltd. is scheduled for 30 July 2026.

View full answer

Is Aarti Industries technically bullish or bearish?

04-Dec-2025

As of December 3, 2025, Aarti Industries has shifted to a bearish trend with moderate strength, supported by daily moving averages and Bollinger Bands, despite mixed signals from the MACD and RSI indicating potential volatility.

As of 3 December 2025, the technical trend has changed from mildly bearish to bearish. The current stance is bearish with moderate strength. Key indicators include the daily moving averages indicating a bearish trend, and both the weekly and monthly Bollinger Bands confirming bearish conditions. The MACD shows a mildly bullish signal on the weekly chart but is bearish on the monthly, which adds to the mixed signals. The RSI is bullish on the monthly but shows no signal on the weekly, indicating potential volatility. Overall, the combination of these indicators suggests a bearish outlook for Aarti Industries in the near term.

View full answer

Is Aarti Industries overvalued or undervalued?

11-Nov-2025

As of November 10, 2025, Aarti Industries is fairly valued with a PE ratio of 52.94 and an EV to EBITDA of 52.28, indicating a premium compared to peers like Godrej Industries, while its recent stock performance has underperformed the Sensex by 17.27%.

As of 10 November 2025, Aarti Industries' valuation grade has moved from attractive to fair, indicating a shift in its perceived value. The company is currently fairly valued, with a PE ratio of 52.94, an EV to EBITDA ratio of 52.28, and a Price to Book Value of 0.25. These ratios suggest that while the company has a high earnings multiple, its book value remains low, which could indicate potential concerns about future profitability.<BR><BR>In comparison to its peers, Aarti Industries' PE ratio is significantly higher than that of Godrej Industries, which stands at 35.42, highlighting a premium valuation. Additionally, Solar Industries, a peer deemed very expensive, has an EV to EBITDA of 59.13, further illustrating that Aarti's valuation is more reasonable relative to some competitors. Recent stock performance shows that Aarti Industries has underperformed the Sensex over the past year, with a decline of 17.27% compared to the Sensex's gain of 5.09%, reinforcing the notion that the stock may be fairly valued at this time.

View full answer

How has been the historical performance of Aarti Industries?

06-Nov-2025

Aarti Industries has experienced significant growth in net sales and total assets from Mar'19 to Mar'25, increasing from INR 4,167.56 crore to INR 7,271.00 crore. However, profitability has declined, with profit after tax dropping from INR 1,307.42 crore in Mar'22 to INR 331.00 crore in Mar'25.

Answer:<BR>The historical performance of Aarti Industries shows a fluctuating trend in key financial metrics over the past several years.<BR><BR>Breakdown:<BR>Aarti Industries' net sales increased from INR 4,167.56 crore in Mar'19 to INR 7,271.00 crore in Mar'25, reflecting a significant growth trajectory. Total operating income followed a similar trend, rising from INR 4,167.56 crore in Mar'19 to INR 7,271.00 crore in Mar'25. However, the company's operating profit (PBDIT) exhibited volatility, peaking at INR 1,929.61 crore in Mar'22 before declining to INR 1,015.00 crore by Mar'25. Profit before tax also saw a decline from INR 1,526.80 crore in Mar'22 to INR 308.00 crore in Mar'25. Consequently, profit after tax decreased from INR 1,307.42 crore in Mar'22 to INR 331.00 crore in Mar'25. The company's total liabilities rose from INR 6,332.50 crore in Mar'20 to INR 10,895.53 crore in Mar'25, while total assets increased from INR 6,332.50 crore to INR 10,895.53 crore over the same period. Cash flow from operating activities improved from INR 1,102.00 crore in Mar'20 to INR 1,241.00 crore in Mar'25, although the net cash flow turned negative in Mar'25 at INR -228.00 crore. Overall, Aarti Industries has shown growth in sales and assets, but profitability has faced challenges in recent years.

View full answer

Who are the top shareholders of the Aarti Industries?

17-Jul-2025

The top shareholders of Aarti Industries include promoters led by Rashesh Chandrakant Gogri (4.09%), institutional investors with mutual funds holding 11.51% and FIIs at 6.29%, and individual investors who own 26.96%. The Life Insurance Corporation of India is the largest public shareholder at 6.8%.

The top shareholders of Aarti Industries include a mix of promoters, institutional investors, and individual shareholders. The majority shareholders are the promoters, with Rashesh Chandrakant Gogri being the promoter with the highest holding at 4.09%. <BR><BR>In terms of institutional holdings, mutual funds hold 11.51% of the shares through 27 schemes, while foreign institutional investors (FIIs) have a stake of 6.29% across 142 entities. The highest public shareholder is the Life Insurance Corporation of India, which holds 6.8%. Individual investors collectively own 26.96% of the company’s shares. <BR><BR>Overall, the ownership structure reflects a strong presence of both promoter and institutional investments.

View full answer

What is the bonus history of the Aarti Industries?

06-Jun-2025

Aarti Industries has issued bonuses to shareholders, with the most recent being a 1:1 bonus on June 22, 2021, and a prior 1:1 bonus on September 27, 2019. This reflects the company's commitment to rewarding its shareholders.

Aarti Industries has a history of issuing bonuses to its shareholders. The most recent bonus was a 1:1 bonus issue, which was announced with an ex-date of June 22, 2021, and the record date was June 23, 2021. Prior to that, the company also issued a 1:1 bonus on September 27, 2019, with a record date of September 30, 2019. This pattern indicates that Aarti Industries has been proactive in rewarding its shareholders through bonus shares.

View full answer

Has Aarti Industries declared dividend?

06-Jun-2025

Yes, Aarti Industries has declared a 20% dividend, amounting to ₹1 per share, with an ex-date of July 26, 2024. While the company has declared a dividend, total returns have varied significantly, showing negative returns in most periods except for the last five years.

Aarti Industries Ltd. has declared a dividend.<BR><BR>Dividend Details:<BR>- Percentage announced: 20%<BR>- Amount per share: 1 per share<BR>- Ex-date: 26 Jul 24<BR><BR>Dividend Yield: 0.21%.<BR><BR>Total Returns by Period:<BR>In the last 6 months, Aarti Industries experienced a price return of 5.86%, with no dividend return, resulting in a total return of 5.86%.<BR><BR>Over the past year, the company saw a price return of -25.13% and a dividend return of 0.15%, leading to a total return of -24.98%.<BR><BR>In the 2-year period, Aarti Industries had a price return of -6.64% and a dividend return of 0.48%, culminating in a total return of -6.16%.<BR><BR>For the 3-year period, the price return was -23.32% with a dividend return of 0.83%, resulting in a total return of -22.49%.<BR><BR>In the last 4 years, the company recorded a price return of -35.22% and a dividend return of 1.12%, leading to a total return of -34.1%.<BR><BR>Over the past 5 years, Aarti Industries achieved a price return of 20.48% and a dividend return of 2.72%, resulting in a total return of 23.2%.<BR><BR>Overall, while Aarti Industries has declared a dividend, the total returns over various periods show significant fluctuations, with negative returns in most periods except for the 5-year timeframe, indicating a mixed performance.

View full answer
iScoreScore
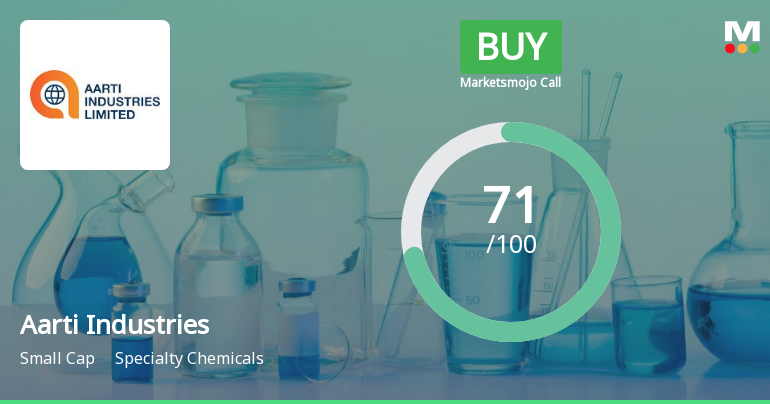
Click here to find our call on this stock
Strong Sell
Sell
Hold
Buy
Strong Buy

Dashboard

1

With a growth in Net Profit of 13.14%, the company declared Very Positive results in Jun 26

  • The company has declared positive results for the last 3 consecutive quarters
  • PAT(9M) At Rs 438.28 cr has Grown at 136.91%
  • PBT LESS OI(Q) At Rs 175.00 cr has Grown at 100.0% (vs previous 4Q average)
  • NET SALES(9M) At Rs 6,910.00 cr has Grown at 26.39%
2

With ROCE of 6.7, it has a Fair valuation with a 2.2 Enterprise value to Capital Employed

3

High Institutional Holdings at 28.11%

stock-summaryMojo Parameters

Mojo Parameters

Loading Valuation Snapshot...

Stock DNA

stock-summary
Industry

Specialty Chemicals

stock-summary
Market cap

INR 18,481 Cr (Small Cap)

stock-summary
P/E

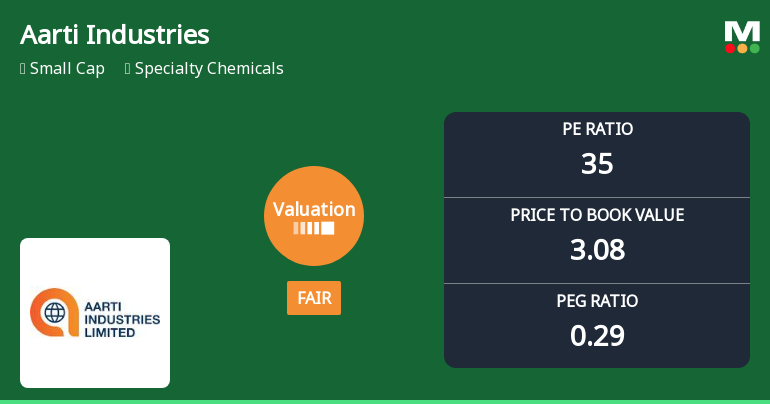
35.00

stock-summary
Industry P/E

43

stock-summary
Dividend Yield

0.00%

stock-summary
Debt Equity

0.73

stock-summary
Return on Equity

6.92%

stock-summary
Price to Book

3.08

Revenue and Profits:
Net Sales:
2,387 Cr
(Quarterly Results - Jun 2026)
Net Profit:
155 Cr
stock-summaryTotal Returns
Total Returns (Price + Dividend) stock-summary
Dividend Yield (0%)
TimePeriod
Price Return
Dividend Return
Total Return
3 Months
9.85%
0.22%
10.07%
6 Months
17.68%
0.24%
17.92%
1 Year
32.18%
0.26%
32.44%
2 Years
-18.23%
0.35%
-17.88%
3 Years
3.76%
0.59%
4.35%
4 Years
-29.85%
0.78%
-29.07%
5 Years
-35.64%
1.05%
-34.59%

Latest dividend: 1 per share ex-dividend date: Aug-18-2025

Risk Adjusted Returns v/s stock-summary
Returns Beta
Icon
Beta has not been calculated since enough price history is not available
stock-summaryNews & Corporate Actions

Announcements stock-summary

Aarti Industries Limited - Updates

28-Nov-2019 | Source : NSE

Aarti Industries Limited has informed the Exchange regarding 'Intimation under Regulation 39(3) of SEBI (Listing Obligations and Disclosure Requirements) Regulations, 2015 '.

Aarti Industries Limited - Updates

26-Nov-2019 | Source : NSE

Aarti Industries Limited has informed the Exchange regarding 'Intimation for incorporation of Wholly Owned Subsidiary (WOS) Companies'.namely - Aarti Organics Limited & Aarti Bharuch Limited

Aarti Industries Limited - Analysts/Institutional Investor Meet/Con. Call Updates

22-Nov-2019 | Source : NSE

Aarti Industries Limited has informed the Exchange regarding Analysts/Institutional Investor Meet/Con. Call Updates

Corporate Actions stock-summary

stock-summary
BOARD MEETING

No Upcoming Board Meetings

stock-summary
DIVIDEND

Aarti Industries Ltd. has declared 20% dividend, ex-date: 11 Sep 26

stock-summary
SPLITS

No Splits history available

stock-summary
BONUS

Aarti Industries Ltd. has announced 1:1 bonus issue, ex-date: 22 Jun 21

stock-summary
RIGHTS

No Rights history available

stock-summaryKey Factors

Quality key factors stock-summary

Factor
Value
Sales Growth (5y)
13.02%
EBIT Growth (5y)
-0.34%
EBIT to Interest (avg)
4.90
Debt to EBITDA (avg)
3.10
Net Debt to Equity (avg)
0.73
Sales to Capital Employed (avg)
0.78
Tax Ratio
Tax Ratio is Negative%
Dividend Payout Ratio
10.96%
Pledged Shares
3.49%
Institutional Holding
28.11%
ROCE (avg)
10.21%
ROE (avg)
12.03%

Valuation key factors

Factor
Value
P/E Ratio
35
Industry P/E
43
Price to Book Value
3.08
EV to EBIT
26.66
EV to EBITDA
17.00
EV to Capital Employed
2.20
EV to Sales
2.52
PEG Ratio
0.29
Dividend Yield
NA
ROCE (Latest)
6.70%
ROE (Latest)
6.92%

Technicals key factors

Indicator
Weekly
Monthly
MACD
Bullish
Mildly Bullish
RSI
No Signal
No Signal
Bollinger Bands
Mildly Bullish
Mildly Bullish
Moving Averages
Bullish (Daily)
KST
Bullish
Bullish
Dow Theory
Mildly Bullish
No Trend
OBV
No Trend
No Trend
stock-summary Technical Indicator Scale: Bearish, Mildly Bearish, Sideways, Mildly Bullish, Bullish  Turned 
stock-summaryShareholding
Shareholding Snapshot : Jun 2026stock-summary
Shareholding Compare (%holding) stock-summary
Majority shareholders

Promoters

Pledged Promoter Holdings

3.4937

Mutual Funds

Held by 21 Schemes (12.12%)

FIIs

Held by 149 FIIs (6.99%)

Promoter with highest holding

Rashesh Chandrakant Gogri (4.09%)

Highest Public shareholder

Life Insurance Corporation Of India (6.8%)

Individual Investors Holdings

25.49%

stock-summaryFinancial
[
  {
    "link": "quarterly",
    "btn_text": "All Quarterly Results",
    "header": "Quarterly Results Snapshot (Consolidated) - Jun'26 - QoQ",
    "rhs": [
      {
        "prefix": "Net Sales ",
        "suffix": "QoQ Growth in quarter ended Jun 2026 is 8.25% vs -4.87% in Mar 2026",
        "dir": 1
      },
      {
        "prefix": "Consolidated Net Profit ",
        "suffix": "QoQ Growth in quarter ended Jun 2026 is 13.14% vs 3.01% in Mar 2026",
        "dir": 1
      }
    ],
    "table": {
      "header": [
        "Jun'26",
        "Mar'26",
        "Change(%)"
      ],
      "body": [
        {
          "field": "Net Sales",
          "val1": "2,387.00",
          "val2": "2,205.00",
          "chgp": "8.25%",
          "chgp_class": "positive"
        },
        {
          "field": "Operating Profit (PBDIT) excl Other Income",
          "val1": "382.00",
          "val2": "341.00",
          "chgp": "12.02%",
          "chgp_class": "positive"
        },
        {
          "field": "Interest",
          "val1": "83.00",
          "val2": "112.00",
          "chgp": "-25.89%",
          "chgp_class": "positive"
        },
        {
          "field": "Exceptional Items",
          "val1": "2.00",
          "val2": "0.00",
          "chgp": "",
          "chgp_class": "neutral"
        },
        {
          "field": "Consolidate Net Profit",
          "val1": "155.00",
          "val2": "137.00",
          "chgp": "13.14%",
          "chgp_class": "positive"
        },
        {
          "field": "Operating Profit Margin (Excl OI)",
          "val1": "16.00%",
          "val2": "15.46%",
          "chgp": "0.54%",
          "chgp_class": "positive"
        }
      ]
    }
  },
  {
    "link": "half-yearly",
    "btn_text": "All Half Yearly Results",
    "header": "Half Yearly Results Snapshot (Consolidated) - Sep'25",
    "rhs": [
      {
        "prefix": "Net Sales ",
        "suffix": " Growth in half year ended Sep 2025 is 8.51% vs 21.34% in Sep 2024",
        "dir": -1
      },
      {
        "prefix": "Consolidated Net Profit ",
        "suffix": " Growth in half year ended Sep 2025 is -21.16% vs 18.12% in Sep 2024",
        "dir": -1
      }
    ],
    "table": {
      "header": [
        "Sep'25",
        "Sep'24",
        "Change(%)"
      ],
      "body": [
        {
          "field": "Net Sales",
          "val1": "3,776.00",
          "val2": "3,480.00",
          "chgp": "8.51%",
          "chgp_class": "positive"
        },
        {
          "field": "Operating Profit (PBDIT) excl Other Income",
          "val1": "502.00",
          "val2": "502.00",
          "chgp": "",
          "chgp_class": "neutral"
        },
        {
          "field": "Interest",
          "val1": "159.00",
          "val2": "126.00",
          "chgp": "26.19%",
          "chgp_class": "negative"
        },
        {
          "field": "Exceptional Items",
          "val1": "22.00",
          "val2": "2.00",
          "chgp": "1,000.00%",
          "chgp_class": "positive"
        },
        {
          "field": "Consolidate Net Profit",
          "val1": "149.00",
          "val2": "189.00",
          "chgp": "-21.16%",
          "chgp_class": "negative"
        },
        {
          "field": "Operating Profit Margin (Excl OI)",
          "val1": "13.29%",
          "val2": "14.43%",
          "chgp": "-1.14%",
          "chgp_class": "negative"
        }
      ]
    }
  },
  {
    "link": "nine-monthly",
    "btn_text": "All Nine Monthly Results",
    "header": "Nine Monthly Results Snapshot (Consolidated) - Dec'25",
    "rhs": [
      {
        "prefix": "Net Sales ",
        "suffix": "YoY Growth in nine months ended Dec 2025 is 14.48% vs 15.72% in Dec 2024",
        "dir": -1
      },
      {
        "prefix": "Consolidated Net Profit ",
        "suffix": "YoY Growth in nine months ended Dec 2025 is 20.00% vs -17.25% in Dec 2024",
        "dir": 1
      }
    ],
    "table": {
      "header": [
        "Dec'25",
        "Dec'24",
        "Change(%)"
      ],
      "body": [
        {
          "field": "Net Sales",
          "val1": "6,094.00",
          "val2": "5,323.00",
          "chgp": "14.48%",
          "chgp_class": "positive"
        },
        {
          "field": "Operating Profit (PBDIT) excl Other Income",
          "val1": "823.00",
          "val2": "733.00",
          "chgp": "12.28%",
          "chgp_class": "positive"
        },
        {
          "field": "Interest",
          "val1": "228.00",
          "val2": "211.00",
          "chgp": "8.06%",
          "chgp_class": "negative"
        },
        {
          "field": "Exceptional Items",
          "val1": "7.00",
          "val2": "2.00",
          "chgp": "250.00%",
          "chgp_class": "positive"
        },
        {
          "field": "Consolidate Net Profit",
          "val1": "282.00",
          "val2": "235.00",
          "chgp": "20.00%",
          "chgp_class": "positive"
        },
        {
          "field": "Operating Profit Margin (Excl OI)",
          "val1": "13.51%",
          "val2": "13.77%",
          "chgp": "-0.26%",
          "chgp_class": "negative"
        }
      ]
    }
  },
  {
    "link": "annual",
    "btn_text": "All Annual Results",
    "header": "Annual Results Snapshot (Consolidated) - Mar'26",
    "rhs": [
      {
        "prefix": "Net Sales ",
        "suffix": "YoY Growth in year ended Mar 2026 is 13.99% vs 14.10% in Mar 2025",
        "dir": -1
      },
      {
        "prefix": "Consolidated Net Profit ",
        "suffix": "YoY Growth in year ended Mar 2026 is 26.97% vs -20.67% in Mar 2025",
        "dir": 1
      }
    ],
    "table": {
      "header": [
        "Mar'26",
        "Mar'25",
        "Change(%)"
      ],
      "body": [
        {
          "field": "Net Sales",
          "val1": "8,286.00",
          "val2": "7,269.00",
          "chgp": "13.99%",
          "chgp_class": "positive"
        },
        {
          "field": "Operating Profit (PBDIT) excl Other Income",
          "val1": "1,167.00",
          "val2": "996.00",
          "chgp": "17.17%",
          "chgp_class": "positive"
        },
        {
          "field": "Interest",
          "val1": "340.00",
          "val2": "275.00",
          "chgp": "23.64%",
          "chgp_class": "negative"
        },
        {
          "field": "Exceptional Items",
          "val1": "7.00",
          "val2": "2.00",
          "chgp": "250.00%",
          "chgp_class": "positive"
        },
        {
          "field": "Consolidate Net Profit",
          "val1": "419.00",
          "val2": "330.00",
          "chgp": "26.97%",
          "chgp_class": "positive"
        },
        {
          "field": "Operating Profit Margin (Excl OI)",
          "val1": "14.08%",
          "val2": "13.70%",
          "chgp": "0.38%",
          "chgp_class": "positive"
        }
      ]
    }
  }
]

Quarterly Results Snapshot (Consolidated) - Jun'26 - QoQstock-summary

Jun'26
Mar'26
Change(%)
Net Sales
2,387.00
2,205.00
8.25%
Operating Profit (PBDIT) excl Other Income
382.00
341.00
12.02%
Interest
83.00
112.00
-25.89%
Exceptional Items
2.00
0.00
Consolidate Net Profit
155.00
137.00
13.14%
Operating Profit Margin (Excl OI)
16.00%
15.46%
0.54%
Values in Rs Cr.
Direction Arrows
Net Sales

QoQ Growth in quarter ended Jun 2026 is 8.25% vs -4.87% in Mar 2026

Direction Arrows
Consolidated Net Profit

QoQ Growth in quarter ended Jun 2026 is 13.14% vs 3.01% in Mar 2026

Half Yearly Results Snapshot (Consolidated) - Sep'25stock-summary

Sep'25
Sep'24
Change(%)
Net Sales
3,776.00
3,480.00
8.51%
Operating Profit (PBDIT) excl Other Income
502.00
502.00
Interest
159.00
126.00
26.19%
Exceptional Items
22.00
2.00
1,000.00%
Consolidate Net Profit
149.00
189.00
-21.16%
Operating Profit Margin (Excl OI)
13.29%
14.43%
-1.14%
Values in Rs Cr.
Direction Arrows
Net Sales

Growth in half year ended Sep 2025 is 8.51% vs 21.34% in Sep 2024

Direction Arrows
Consolidated Net Profit

Growth in half year ended Sep 2025 is -21.16% vs 18.12% in Sep 2024

Nine Monthly Results Snapshot (Consolidated) - Dec'25stock-summary

Dec'25
Dec'24
Change(%)
Net Sales
6,094.00
5,323.00
14.48%
Operating Profit (PBDIT) excl Other Income
823.00
733.00
12.28%
Interest
228.00
211.00
8.06%
Exceptional Items
7.00
2.00
250.00%
Consolidate Net Profit
282.00
235.00
20.00%
Operating Profit Margin (Excl OI)
13.51%
13.77%
-0.26%
Values in Rs Cr.
Direction Arrows
Net Sales

YoY Growth in nine months ended Dec 2025 is 14.48% vs 15.72% in Dec 2024

Direction Arrows
Consolidated Net Profit

YoY Growth in nine months ended Dec 2025 is 20.00% vs -17.25% in Dec 2024

Annual Results Snapshot (Consolidated) - Mar'26stock-summary

Mar'26
Mar'25
Change(%)
Net Sales
8,286.00
7,269.00
13.99%
Operating Profit (PBDIT) excl Other Income
1,167.00
996.00
17.17%
Interest
340.00
275.00
23.64%
Exceptional Items
7.00
2.00
250.00%
Consolidate Net Profit
419.00
330.00
26.97%
Operating Profit Margin (Excl OI)
14.08%
13.70%
0.38%
Values in Rs Cr.
Direction Arrows
Net Sales

YoY Growth in year ended Mar 2026 is 13.99% vs 14.10% in Mar 2025

Direction Arrows
Consolidated Net Profit

YoY Growth in year ended Mar 2026 is 26.97% vs -20.67% in Mar 2025

stock-summaryCompany CV
About Aarti Industries Ltd. stock-summary
stock-summary
Aarti Industries Ltd.
Small Cap
Specialty Chemicals
Aarti Industries Limited is one of the most competitive and highly integrated benzene-based speciality chemical company in the world. The Company is a rare instance of a global speciality chemicals company that combines process chemistry competence (recipe focus) with scale-up of engineering competence (asset utilisation). The Company has evolved as an Indian multinational selecting to manufacture out of India and servicing the varied needs of the global markets.
Company Coordinates stock-summary
Company Details
Plot Nos 801 801/23, GIDC Estate Phase III VAPI Gujarat : 396195
stock-summary
Tel: 91-2638-55976666/25918195
stock-summary
investorrelations@aartigroup.com
Registrar Details
Link Intime India Pvt Ltd, C-13 Pannalal Silk Compound, L B S Marg, Bhandup , Mumbai