
Compare Sarla Performanc with Similar Stocks
Stock DNA
Garments & Apparels
INR 820 Cr (Micro Cap)
13.00
25
2.04%
0.22
12.43%
1.59
Total Returns (Price + Dividend) 
Latest dividend: 1.9939629990262902 per share ex-dividend date: Jul-22-2026
Risk Adjusted Returns v/s
Returns Beta

News
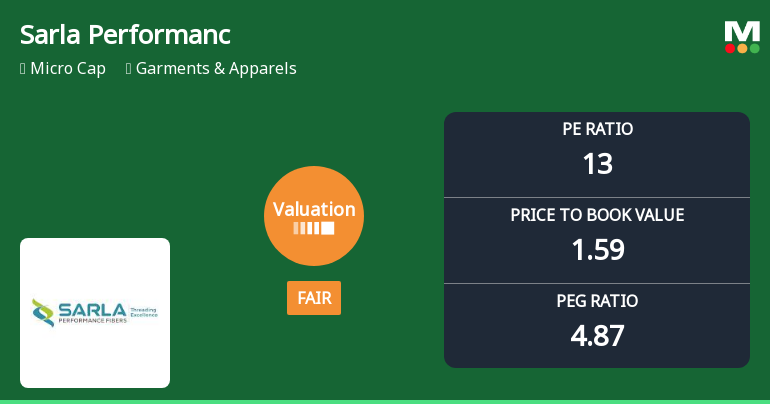
Sarla Performance Fibers Ltd Valuation Shifts Signal Changing Market Sentiment
Sarla Performance Fibers Ltd, a micro-cap player in the Garments & Apparels sector, has witnessed a notable shift in its valuation parameters, moving from an expensive to a fair valuation grade. This change reflects evolving market perceptions amid mixed financial metrics and peer comparisons, prompting a reassessment of its price attractiveness for investors.
Read full news articleWhen is the next results date for Sarla Performance Fibers Ltd?
The next results date for Sarla Performance Fibers Ltd is scheduled for August 5, 2026....
Read full news article
Sarla Performance Fibers Ltd Downgraded to Sell Amid Weak Financials and Technical Signals
Sarla Performance Fibers Ltd, a micro-cap player in the Garments & Apparels sector, has seen its investment rating downgraded from Hold to Sell as of 28 Jul 2026. This shift reflects a combination of deteriorating financial trends, expensive valuation metrics, and a nuanced technical outlook, despite some long-term outperformance relative to the Sensex. The company’s Mojo Score now stands at 44.0, signalling caution for investors.
Read full news article Announcements
AGM\/Book Closure
05-Sep-2019 | Source : NSE
| Sarla Performance Fibers Limited has informed the Exchange that the Register of Members & Share Transfer Books of the Company will remain closed from September 20, 2019 to September 27, 2019 (both days inclusive) for the purpose of Annual General Meeting and Payment of Dividend. |
AGM\/Book Closure
04-Sep-2019 | Source : NSE
| Sarla Performance Fibers Limited has informed the Exchange that the Register of Members & Share Transfer Books of the Company will remain closed from September 20, 2019 to September 27, 2019 (both days inclusive) for the purpose of Annual General Meeting and payment of dividend. |
Shareholders meeting
30-Aug-2019 | Source : NSE
| Sarla Performance Fibers Limited has informed the Exchange regarding Notice of Annual General Meeting to be held on September 27, 2019 |
Corporate Actions

05 Aug 2026

Sarla Performance Fibers Ltd has declared 200% dividend, ex-date: 22 Jul 26

Sarla Performance Fibers Ltd has announced 1:10 stock split, ex-date: 29 Oct 15

No Bonus history available

No Rights history available
Quality key factors
Valuation key factors
Technicals key factors
 Technical Indicator Scale: Bearish, Mildly Bearish, Sideways, Mildly Bullish, Bullish Turned
 Shareholding Snapshot : Jun 2026
Shareholding Compare (%holding)
Promoters
None
Held by 0 Schemes
Held by 3 FIIs (0.64%)
Satidham Industries Private Limited (30.36%)
Anil Kumar Goel (2.73%)
29.66%
Quarterly Results Snapshot (Consolidated) - Mar'26 - QoQ

QoQ Growth in quarter ended Mar 2026 is 14.94% vs -16.72% in Dec 2025

QoQ Growth in quarter ended Mar 2026 is -1,262.57% vs -72.94% in Dec 2025
Half Yearly Results Snapshot (Consolidated) - Sep'25
Growth in half year ended Sep 2025 is -6.76% vs 24.03% in Sep 2024
Growth in half year ended Sep 2025 is 15.33% vs 178.36% in Sep 2024
Nine Monthly Results Snapshot (Consolidated) - Dec'25
YoY Growth in nine months ended Dec 2025 is -8.59% vs 17.79% in Dec 2024
YoY Growth in nine months ended Dec 2025 is -6.36% vs 131.78% in Dec 2024
Annual Results Snapshot (Consolidated) - Mar'26
YoY Growth in year ended Mar 2026 is -6.06% vs 11.44% in Mar 2025
YoY Growth in year ended Mar 2026 is -121.06% vs 89.49% in Mar 2025
About Sarla Performance Fibers Ltd

Company Coordinates


