
Compare Om Infra with Similar Stocks
Dashboard
Weak Long Term Fundamental Strength with a -8.14% CAGR growth in Operating Profits over the last 5 years
- Company's ability to service its debt is weak with a poor EBIT to Interest (avg) ratio of 1.25
- The company has been able to generate a Return on Equity (avg) of 3.96% signifying low profitability per unit of shareholders funds
Flat results in Mar 26
With ROE of 2.6, it has a Expensive valuation with a 1.1 Price to Book Value
Underperformed the market in the last 1 year
Total Returns (Price + Dividend) 
Latest dividend: 0.3919093851132686 per share ex-dividend date: Sep-22-2025
Risk Adjusted Returns v/s
Returns Beta

News

Om Infra Ltd Downgraded to Strong Sell Amid Weak Financials and Valuation Concerns
Om Infra Ltd has been downgraded from a Sell to a Strong Sell rating as of 17 Jun 2026, reflecting deteriorating fundamentals across key parameters including quality, valuation, financial trends, and technical indicators. The construction micro-cap’s recent performance and financial metrics have raised significant concerns, prompting a reassessment of its investment appeal.
Read full news article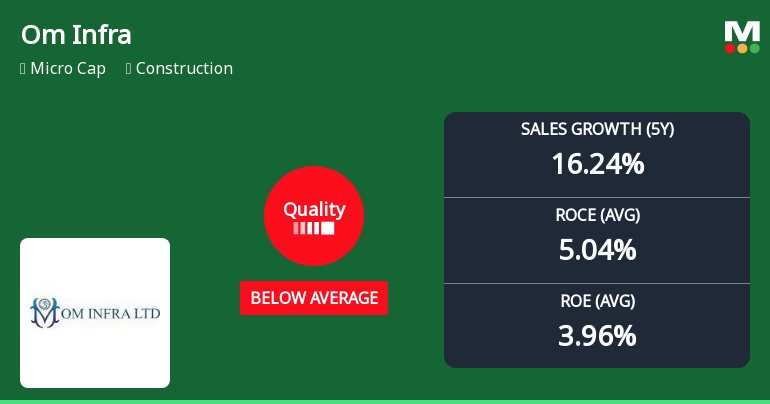
Om Infra Ltd Downgraded to Strong Sell as Quality Parameters Deteriorate
Om Infra Ltd, a micro-cap player in the construction sector, has seen a significant downgrade in its quality grading from average to below average, prompting MarketsMOJO to revise its rating from Sell to Strong Sell as of 17 June 2026. This shift reflects deteriorating business fundamentals, including weakening returns on equity and capital employed, alongside inconsistent earnings growth and modest debt levels that no longer inspire confidence among investors.
Read full news article
Om Infra Ltd is Rated Sell
Om Infra Ltd is rated 'Sell' by MarketsMOJO, with this rating last updated on 14 May 2026. However, the analysis and financial metrics discussed here reflect the stock's current position as of 15 June 2026, providing investors with the latest insights into the company’s performance and outlook.
Read full news article Announcements
OM Metals Infraprojects Limited - Updates
18-Nov-2019 | Source : NSEOM Metals Infraprojects Limited has informed the Exchange regarding 'Newspaper publication of Financial Results'.
OM Metals Infraprojects Limited - Updates
04-Nov-2019 | Source : NSEOM Metals Infraprojects Limited has informed the Exchange regarding 'Newspaper Publication'.
OM Metals Infraprojects Limited - Updates
31-Oct-2019 | Source : NSEOM Metals Infraprojects Limited has informed the Exchange regarding 'Interim Relief out of Arbitration proceedings in Road Project'.
Corporate Actions

No Upcoming Board Meetings

Om Infra Ltd has declared 40% dividend, ex-date: 22 Sep 25

No Splits history available

No Bonus history available

No Rights history available
Quality key factors
Valuation key factors
Technicals key factors
 Technical Indicator Scale: Bearish, Mildly Bearish, Sideways, Mildly Bullish, Bullish Turned
 Shareholding Snapshot : Mar 2026
Shareholding Compare (%holding)
Promoters
None
Held by 1 Schemes (4.06%)
Held by 6 FIIs (0.11%)
T C Kothari And Sons Family Trust (11.85%)
Quant Mutual Fund A/c Quant Infrastructure Fund (4.06%)
22.11%
Quarterly Results Snapshot (Consolidated) - Mar'26 - QoQ

QoQ Growth in quarter ended Mar 2026 is 43.18% vs -9.67% in Dec 2025

QoQ Growth in quarter ended Mar 2026 is -20.05% vs 28.25% in Dec 2025
Half Yearly Results Snapshot (Consolidated) - Sep'25
Growth in half year ended Sep 2025 is -44.07% vs -25.37% in Sep 2024
Growth in half year ended Sep 2025 is -67.74% vs -56.65% in Sep 2024
Nine Monthly Results Snapshot (Consolidated) - Dec'25
YoY Growth in nine months ended Dec 2025 is -37.13% vs -33.91% in Dec 2024
YoY Growth in nine months ended Dec 2025 is -36.54% vs -52.17% in Dec 2024
Annual Results Snapshot (Consolidated) - Mar'26
YoY Growth in year ended Mar 2026 is -29.83% vs -36.02% in Mar 2025
YoY Growth in year ended Mar 2026 is -42.73% vs -23.88% in Mar 2025
About Om Infra Ltd

Company Coordinates


