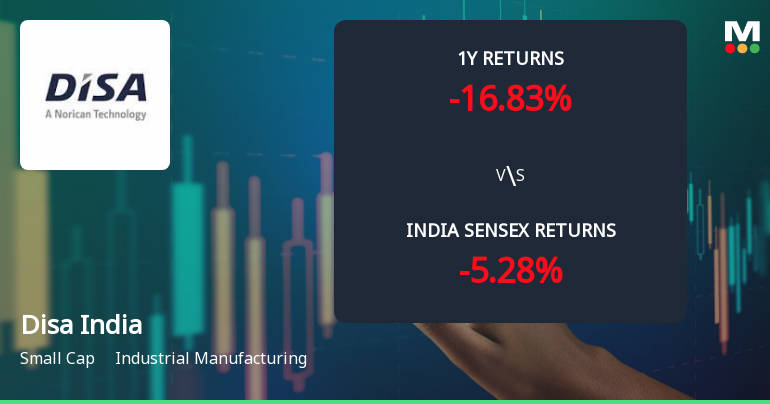
Disa India

  • Market Cap: Small Cap
  • Industry: Industrial Manufacturing
  • ISIN: INE131C01011
  • NSEID: DISAQ
  • BSEID: 500068
INR
11,844.00
336 (2.92%)
BSENSE

Aug 21, 10:24 AM

BSE+NSE Vol: 102

  • Price Points
  • Score
  • Mojo Parameters
  • Total Return
  • News and Corporate Actions
  • Key factors
  • Shareholding
  • Financials
  • CompanyCV
stock-summaryPrice Point
High/Low

1Day

52 Week

Valuation
Technical
Day's Volume

CASH

102 (-5.90%) Volume

Shareholding (Jun 2026)

FII

0.02%

Held by 2 FIIs

DII

8.31%

Held by 8 DIIs

Promoter

74.82%

Why is Disa India Ltd falling/rising?

21-Aug-2026

As of 20-Aug, Disa India Ltd's stock price is Rs 11,577.90, down 2.71%, reflecting a broader trend of underperformance against the Sensex. The stock has declined 4.22% over the past month, with bearish indicators and concerns over financial performance contributing to its downward trajectory.

As of 20-Aug, Disa India Ltd's stock price is falling, currently at Rs 11,577.90, which reflects a decrease of Rs 322.1 or 2.71%. This decline is part of a broader trend, as the stock has underperformed against the benchmark Sensex, which has seen a slight decline of 0.69% over the past week. Over the last month, Disa India Ltd's stock has dropped by 4.22%, while the Sensex has only decreased by 0.22%. <BR><BR>Today's performance indicates a significant underperformance, with the stock falling after two consecutive days of gains. It reached an intraday low of Rs 11,480, marking a 3.53% drop. Additionally, the stock is trading below its 5-day, 20-day, 50-day, 100-day, and 200-day moving averages, suggesting a bearish trend. <BR><BR>Investor participation appears to be declining, as evidenced by a 14.21% drop in delivery volume compared to the 5-day average. Furthermore, the company's financial performance has raised concerns, with a reported operating cash flow at its lowest and a significant decline in profit after tax compared to previous quarters. <BR><BR>Despite having a high return on equity (ROE) of 17.86% and being net-debt free, the stock's valuation is considered expensive with a price-to-book value of 5.5, and it has consistently underperformed against the benchmark over the last three years. This combination of factors contributes to the stock's current downward trajectory.

View full answer

Should I buy, sell or hold Disa India Ltd?

20-Aug-2026

Who are in the management team of Disa India?

14-Aug-2026

The management team of Disa India includes Deepa Hingorani (Chairperson), Lokesh Saxena (Managing Director), and several non-executive and independent directors, along with Shrithee M S as Company Secretary.

The management team of Disa India includes the following members:<BR><BR>1. **Deepa Hingorani** - Chairperson and Independent Director<BR>2. **Lokesh Saxena** - Managing Director<BR>3. **Anders Wilhjelm** - Non-Executive & Non-Independent Director<BR>4. **Ulla Hartvig Plathe Tonnesen** - Non-Executive & Non-Independent Director<BR>5. **Bhagya Chandra Rao** - Independent Director<BR>6. **Michael Declan Guerin** - Non-Executive & Non-Independent Director<BR>7. **Shrithee M S** - Company Secretary & Compliance Officer<BR><BR>If you have any more questions about Disa India or its management, feel free to ask!

View full answer

What does Disa India do?

14-Aug-2026

Disa India Ltd is a small-cap industrial manufacturing company specializing in foundry machinery, including moulding and sand plants. As of June 2026, it reported net sales of 87 Cr and a net profit of 11 Cr, with a market cap of INR 1,690 Cr.

Overview:<BR>Disa India Ltd is a small-cap company in the industrial manufacturing sector that specializes in the production of foundry machinery, including moulding plants, sand plants, and shot blasting machines.<BR><BR>History:<BR>Disa India Ltd was established in May 1984 as BMD Industries and underwent a name change from George Fisher Disa Limited. The latest quarterly results reported are for June 2026, showing net sales and profit figures.<BR><BR>Financial Snapshot:<BR>Net Sales: 87 Cr (Quarterly Results - Jun 2026) <BR>Net Profit: 11 Cr (Quarterly Results - Jun 2026) <BR>Market Cap: INR 1,690 Cr (Small Cap)<BR><BR>Key Metrics:<BR>P/E: 31.00 <BR>Industry P/E: 41 <BR>Dividend Yield: 1.73% <BR>Debt-Equity: -0.71 <BR>Return on Equity: 18.43% <BR>Price to Book: 5.50 <BR><BR>Contact Details:<BR>Address: World Trade Center 6th Flr, Unit No S-604 26/1 Rajkumar Rd Bangalore Karnataka : 560055 <BR>Email: bangalore@noricangroup.com <BR>Website: http://www.disagroup.com

View full answer

Who are the peers of the Disa India?

14-Aug-2026

Disa India's peers include Kilburn Engg., Indian Hume Pipe, Kabra Extrusion, Walchan. Inds., Gala Precis. Eng, Everest Kanto, Vinyas Innovativ, Macpower CNC, and ICE Make Refrig. In terms of management risk, Disa India has excellent management risk and capital structure, with a 1-year return of -17.21%, while Kabra Extrusion leads with an 89.40% return.

Peers: The peers of Disa India are Kilburn Engg., Indian Hume Pipe, Kabra Extrusion, Walchan. Inds., Gala Precis. Eng, Everest Kanto, Vinyas Innovativ, Macpower CNC, and ICE Make Refrig.<BR><BR>Quality Snapshot: Excellent management risk is observed at Disa India, while Average management risk is found at Kilburn Engg., Indian Hume Pipe, Kabra Extrusion, Gala Precis. Eng, Everest Kanto, Vinyas Innovativ, Macpower CNC, and ICE Make Refrig. Below Average management risk is noted at Walchan. Inds. In terms of growth, Excellent growth is seen at Vinyas Innovativ, Good growth is observed at Kilburn Engg. and Macpower CNC, while Below Average growth is found at Indian Hume Pipe, Kabra Extrusion, Disa India, Walchan. Inds., Gala Precis. Eng, and Everest Kanto. For capital structure, Excellent capital structure is noted at Disa India, Kilburn Engg., Gala Precis. Eng, Everest Kanto, Macpower CNC, and ICE Make Refrig., while Average capital structure is found at Indian Hume Pipe and Kabra Extrusion, and Below Average capital structure is seen at Walchan. Inds.<BR><BR>Return Snapshot: Kabra Extrusion has the highest 1-year return at 89.40%, while Kilburn Engg. has the lowest at -33.91%. Disa India's 1-year return is -17.21%, which is higher than Kilburn Engg. but lower than Kabra Extrusion. Additionally, peers such as Walchan. Inds. and Everest Kanto have negative six-month returns.

View full answer

How big is Disa India?

14-Aug-2026

As of 14th August, Disa India Ltd has a market capitalization of 1,705.78 Cr, with recent net sales of 410.29 Cr and net profit of 51.16 Cr over the last four quarters.

As of 14th August, <BR><BR>Market Cap: Disa India Ltd has a market capitalization of 1,705.78 Cr, categorizing it as a Small Cap company.<BR><BR>Recent Quarterly Performance: The sum of Net Sales for the latest 4 quarters is 410.29 Cr, while the sum of Net Profit for the same period is 51.16 Cr.<BR><BR>Balance Sheet Snapshot: The reporting period for the latest annual data is March 2026. Shareholder's Funds are valued at 305.14 Cr, and Total Assets amount to 473.44 Cr.

View full answer

When is the next results date for Disa India Ltd?

07-Aug-2026

The next results date for Disa India Ltd is 12 August 2026.

The next results date for Disa India Ltd is scheduled for 12 August 2026.

View full answer

Are Disa India Ltd latest results good or bad?

21-May-2026

Disa India Ltd's latest results are mixed; while net profit increased 3.62% year-on-year to ₹13.18 crore, revenue fell 16.17% year-on-year and 29.40% sequentially, raising concerns about demand. Despite improved operating and PAT margins, the significant revenue decline suggests caution for investors.

Disa India Ltd's latest results present a mixed picture. For Q4 FY26, the company reported a net profit of ₹13.18 crore, which is a 3.62% increase year-on-year, indicating some resilience in profitability. However, this represents a significant 13.29% decline compared to the previous quarter. <BR><BR>On the revenue front, Disa India experienced a notable decline, with Q4 revenue falling to ₹90.81 crore, down 16.17% year-on-year and a concerning 29.40% sequential drop from ₹128.62 crore in Q3 FY26. This marks the lowest quarterly sales figure in the past year, raising concerns about demand in the industrial machinery sector.<BR><BR>Despite the revenue challenges, the company managed to improve its operating margin, which stood at 17.38%, reflecting effective cost management. Additionally, the PAT margin improved to 14.51% from 11.74% a year ago, showcasing strong capital efficiency with a return on equity of 18.74%.<BR><BR>Overall, while Disa India maintains strong operational fundamentals and profitability metrics, the sharp decline in revenue raises questions about future demand and order visibility. This mixed performance suggests caution for investors, particularly given the premium valuation and recent stock price trends.

View full answer

Is Disa India technically bullish or bearish?

14-Nov-2025

As of November 13, 2025, the technical trend is bearish with moderate strength, driven by daily moving averages and Bollinger Bands, despite mixed signals from the MACD and Dow Theory.

As of 13 November 2025, the technical trend has changed from mildly bearish to bearish. The current stance is bearish with moderate strength. Key indicators driving this include the daily moving averages indicating a bearish trend, along with weekly and monthly Bollinger Bands and KST also showing bearish signals. The MACD presents a mildly bullish signal on the weekly timeframe but is mildly bearish on the monthly, which adds to the mixed signals. The Dow Theory shows no trend on the weekly but is mildly bullish on the monthly, indicating some divergence. Overall, the bearish indicators dominate the current technical outlook.

View full answer

How has been the historical performance of Disa India?

06-Nov-2025

Disa India has shown strong historical performance, with consolidated net sales increasing from INR 261.90 crore in March 2023 to INR 390.34 crore in March 2025, alongside significant growth in profits and total assets. The company has demonstrated robust growth in sales, profits, and asset accumulation over the years.

Answer:<BR>Disa India has shown a positive trend in its historical performance, particularly in net sales and profit metrics over the past several years.<BR><BR>Breakdown:<BR>Disa India's consolidated net sales have increased significantly from INR 261.90 crore in March 2023 to INR 390.34 crore in March 2025, reflecting a strong growth trajectory. The total operating income has followed a similar trend, rising from INR 256.07 crore in March 2022 to INR 390.34 crore in March 2025. The company's operating profit (PBDIT) has also improved, reaching INR 79.45 crore in March 2025, up from INR 45.37 crore in March 2023. Profit before tax has increased from INR 40.23 crore in March 2023 to INR 68.69 crore in March 2025, while profit after tax has risen from INR 29.77 crore to INR 50.42 crore in the same period. The company's total assets have grown from INR 354.74 crore in March 2023 to INR 435.06 crore in March 2025, indicating a solid asset base. Additionally, cash flow from operating activities has shown fluctuations but reached INR 31 crore in March 2025, contributing to a net cash inflow of INR 15 crore for the same period. Overall, Disa India has demonstrated robust growth in sales, profits, and asset accumulation over the years.

View full answer

Who are the top shareholders of the Disa India?

17-Jul-2025

The top shareholders of Disa India are Disa Holdings Ag with 54.1%, SBI Contra Fund at 7.89%, and individual investors holding 14.35%. Additionally, two mutual fund schemes account for 8.23%, while foreign institutional investors hold 0.02%, with no pledged promoter holdings reported.

The top shareholders of Disa India include Disa Holdings Ag, which holds a significant 54.1% of the shares. Other notable shareholders are the SBI Contra Fund, with 7.89%, and individual investors, who collectively hold 14.35%. Additionally, there are two mutual fund schemes that account for 8.23% of the holdings, while foreign institutional investors (FIIs) hold a minimal 0.02%. There are no pledged promoter holdings reported.

View full answer

Is Disa India overvalued or undervalued?

09-Jun-2025

As of December 27, 2022, Disa India Ltd. is considered very expensive and overvalued, with high financial ratios and a year-to-date return of -16.32%, significantly underperforming the Sensex's 5.58%.

As of 27 December 2022, the valuation grade for Disa India Ltd. moved from expensive to very expensive, indicating a significant shift in its perceived value. The company is currently overvalued based on its financial metrics. Key ratios include a PE Ratio of 36.92, an EV to EBITDA of 29.71, and a Price to Book Value of 7.75, all of which suggest that the stock is trading at a premium compared to its earnings and assets.<BR><BR>In comparison to its peers, Disa India Ltd. has a similar PEG Ratio of 1.76, but it stands out with a notably high ROCE of 132.74%, which may indicate strong operational efficiency. However, when looking at the broader market, the company's recent performance has lagged behind the Sensex, with a year-to-date return of -16.32% compared to the Sensex's 5.58%. This underperformance, coupled with its elevated valuation metrics, reinforces the conclusion that Disa India Ltd. is overvalued.

View full answer

Has Disa India declared dividend?

06-Jun-2025

Yes, Disa India Ltd has declared a 1000% dividend, amounting to ₹100 per share, with an ex-date of February 11, 2025. Despite recent short-term declines, the company has shown strong total returns over longer periods, particularly in the 2 to 5-year ranges.

Disa India Ltd has declared a 1000% dividend.<BR><BR>Dividend Details:<BR>- Percentage announced: 1000%<BR>- Amount per share: 100 per share<BR>- Ex-date: 11 Feb 25<BR><BR>Dividend Yield: 1.45%.<BR><BR>Total Returns by Period:<BR>In the last 6 months, the price return was -21.14%, the dividend return was 0.57%, resulting in a total return of -20.57%.<BR><BR>Over the past year, the price return was -10.47%, the dividend return was 1.31%, leading to a total return of -9.16%.<BR><BR>In the 2-year period, the price return was 64.47%, the dividend return was 3.18%, which resulted in a total return of 67.65%.<BR><BR>For the 3-year period, the price return was 127.35%, the dividend return was 7.03%, culminating in a total return of 134.38%.<BR><BR>In the last 4 years, the price return was 212.96%, the dividend return was 11.68%, resulting in a total return of 224.64%.<BR><BR>Over the past 5 years, the price return was 296.3%, the dividend return was 17.03%, leading to a total return of 313.33%.<BR><BR>Overall, Disa India Ltd has declared a significant dividend, which contributes positively to the total returns over longer periods, particularly in the 2 to 5-year ranges, indicating a strong performance despite recent short-term declines.

View full answer
iScoreScore
Click here to find our call on this stock
Strong Sell
Sell
Hold
Buy
Strong Buy

Dashboard

1

Poor long term growth as Operating profit has grown by an annual rate 15.01% of over the last 5 years

 
2

Negative results in Jun 26

3

With ROE of 18.4, it has a Very Expensive valuation with a 5.5 Price to Book Value

stock-summaryMojo Parameters

Mojo Parameters

Loading Valuation Snapshot...

Stock DNA

stock-summary
Industry

Industrial Manufacturing

stock-summary
Market cap

INR 1,722 Cr (Small Cap)

stock-summary
P/E

31.00

stock-summary
Industry P/E

42

stock-summary
Dividend Yield

1.74%

stock-summary
Debt Equity

-0.71

stock-summary
Return on Equity

18.43%

stock-summary
Price to Book

5.47

Revenue and Profits:
Net Sales:
87 Cr
(Quarterly Results - Jun 2026)
Net Profit:
11 Cr
stock-summaryTotal Returns
Total Returns (Price + Dividend) stock-summary
Dividend Yield (1.74%)
TimePeriod
Price Return
Dividend Return
Total Return
3 Months
2.17%
1.72%
3.89%
6 Months
0%
0%
0.0%
1 Year
0%
0%
0.0%
2 Years
0%
0%
0.0%
3 Years
0%
0%
0.0%
4 Years
0%
0%
0.0%
5 Years
0%
0%
0.0%

Latest dividend: 199.27994115997743 per share ex-dividend date: Aug-05-2026

Risk Adjusted Returns v/s stock-summary
Returns Beta
Icon
Beta has not been calculated since enough price history is not available
stock-summaryNews & Corporate Actions

News

Announcements stock-summary

Icon
No announcement available

Corporate Actions stock-summary

stock-summary
BOARD MEETING

No Upcoming Board Meetings

stock-summary
DIVIDEND

Disa India Ltd has declared 2000% dividend, ex-date: 05 Aug 26

stock-summary
SPLITS

No Splits history available

stock-summary
BONUS

No Bonus history available

stock-summary
RIGHTS

No Rights history available

stock-summaryKey Factors

Quality key factors stock-summary

Factor
Value
Sales Growth (5y)
15.97%
EBIT Growth (5y)
15.01%
EBIT to Interest (avg)
48.56
Debt to EBITDA (avg)
Net Debt is too low
Net Debt to Equity (avg)
-0.71
Sales to Capital Employed (avg)
1.29
Tax Ratio
25.88%
Dividend Payout Ratio
54.08%
Pledged Shares
0
Institutional Holding
8.32%
ROCE (avg)
152.90%
ROE (avg)
17.86%

Valuation key factors

Factor
Value
P/E Ratio
31
Industry P/E
28
Price to Book Value
5.47
EV to EBIT
24.44
EV to EBITDA
22.52
EV to Capital Employed
16.23
EV to Sales
3.54
PEG Ratio
10.32
Dividend Yield
1.74%
ROCE (Latest)
69.42%
ROE (Latest)
18.43%

Technicals key factors

Indicator
Weekly
Monthly
MACD
Bearish
Bearish
RSI
No Signal
No Signal
Bollinger Bands
Bearish
Bearish
Moving Averages
Bearish (Daily)
KST
Bullish
Bearish
Dow Theory
No Trend
Mildly Bullish
OBV
Mildly Bearish
Bullish
stock-summary Technical Indicator Scale: Bearish, Mildly Bearish, Sideways, Mildly Bullish, Bullish  Turned 
stock-summaryShareholding
Shareholding Snapshot : Jun 2026stock-summary
Shareholding Compare (%holding) stock-summary
Majority shareholders

Promoters

Pledged Promoter Holdings

None

Mutual Funds

Held by 3 Schemes (8.27%)

FIIs

Held by 2 FIIs (0.02%)

Promoter with highest holding

Disa Holdings Ag (54.1%)

Highest Public shareholder

Sbi Contra Fund (7.89%)

Individual Investors Holdings

14.08%

stock-summaryFinancial
[
  {
    "link": "quarterly",
    "btn_text": "All Quarterly Results",
    "header": "Quarterly Results Snapshot (Consolidated) - Jun'26 - QoQ",
    "rhs": [
      {
        "prefix": "Net Sales ",
        "suffix": "QoQ Growth in quarter ended Jun 2026 is -4.02% vs -29.40% in Mar 2026",
        "dir": 1
      },
      {
        "prefix": "Consolidated Net Profit ",
        "suffix": "QoQ Growth in quarter ended Jun 2026 is -19.73% vs -13.29% in Mar 2026",
        "dir": -1
      }
    ],
    "table": {
      "header": [
        "Jun'26",
        "Mar'26",
        "Change(%)"
      ],
      "body": [
        {
          "field": "Net Sales",
          "val1": "87.16",
          "val2": "90.81",
          "chgp": "-4.02%",
          "chgp_class": "negative"
        },
        {
          "field": "Operating Profit (PBDIT) excl Other Income",
          "val1": "12.61",
          "val2": "15.78",
          "chgp": "-20.09%",
          "chgp_class": "negative"
        },
        {
          "field": "Interest",
          "val1": "0.27",
          "val2": "0.01",
          "chgp": "2,600.00%",
          "chgp_class": "negative"
        },
        {
          "field": "Exceptional Items",
          "val1": "0.00",
          "val2": "0.00",
          "chgp": "",
          "chgp_class": "neutral"
        },
        {
          "field": "Consolidate Net Profit",
          "val1": "10.58",
          "val2": "13.18",
          "chgp": "-19.73%",
          "chgp_class": "negative"
        },
        {
          "field": "Operating Profit Margin (Excl OI)",
          "val1": "14.47%",
          "val2": "17.38%",
          "chgp": "-2.91%",
          "chgp_class": "negative"
        }
      ]
    }
  },
  {
    "link": "half-yearly",
    "btn_text": "All Half Yearly Results",
    "header": "Half Yearly Results Snapshot (Consolidated) - Sep'25",
    "rhs": [
      {
        "prefix": "Net Sales ",
        "suffix": " Growth in half year ended Sep 2025 is 12.59% vs 6.74% in Sep 2024",
        "dir": 1
      },
      {
        "prefix": "Consolidated Net Profit ",
        "suffix": " Growth in half year ended Sep 2025 is -8.82% vs 15.48% in Sep 2024",
        "dir": -1
      }
    ],
    "table": {
      "header": [
        "Sep'25",
        "Sep'24",
        "Change(%)"
      ],
      "body": [
        {
          "field": "Net Sales",
          "val1": "205.67",
          "val2": "182.67",
          "chgp": "12.59%",
          "chgp_class": "positive"
        },
        {
          "field": "Operating Profit (PBDIT) excl Other Income",
          "val1": "29.34",
          "val2": "29.37",
          "chgp": "-0.10%",
          "chgp_class": "negative"
        },
        {
          "field": "Interest",
          "val1": "0.25",
          "val2": "0.28",
          "chgp": "-10.71%",
          "chgp_class": "positive"
        },
        {
          "field": "Exceptional Items",
          "val1": "0.00",
          "val2": "0.00",
          "chgp": "",
          "chgp_class": "neutral"
        },
        {
          "field": "Consolidate Net Profit",
          "val1": "25.24",
          "val2": "27.68",
          "chgp": "-8.82%",
          "chgp_class": "negative"
        },
        {
          "field": "Operating Profit Margin (Excl OI)",
          "val1": "14.27%",
          "val2": "16.08%",
          "chgp": "-1.81%",
          "chgp_class": "negative"
        }
      ]
    }
  },
  {
    "link": "nine-monthly",
    "btn_text": "All Nine Monthly Results",
    "header": "Nine Monthly Results Snapshot (Consolidated) - Dec'25",
    "rhs": [
      {
        "prefix": "Net Sales ",
        "suffix": "YoY Growth in nine months ended Dec 2025 is 18.54% vs 21.46% in Dec 2024",
        "dir": -1
      },
      {
        "prefix": "Consolidated Net Profit ",
        "suffix": "YoY Growth in nine months ended Dec 2025 is 7.27% vs 26.85% in Dec 2024",
        "dir": -1
      }
    ],
    "table": {
      "header": [
        "Dec'25",
        "Dec'24",
        "Change(%)"
      ],
      "body": [
        {
          "field": "Net Sales",
          "val1": "334.29",
          "val2": "282.01",
          "chgp": "18.54%",
          "chgp_class": "positive"
        },
        {
          "field": "Operating Profit (PBDIT) excl Other Income",
          "val1": "51.09",
          "val2": "41.55",
          "chgp": "22.96%",
          "chgp_class": "positive"
        },
        {
          "field": "Interest",
          "val1": "0.34",
          "val2": "0.40",
          "chgp": "-15.00%",
          "chgp_class": "positive"
        },
        {
          "field": "Exceptional Items",
          "val1": "-3.51",
          "val2": "-1.26",
          "chgp": "-178.57%",
          "chgp_class": "negative"
        },
        {
          "field": "Consolidate Net Profit",
          "val1": "40.44",
          "val2": "37.70",
          "chgp": "7.27%",
          "chgp_class": "positive"
        },
        {
          "field": "Operating Profit Margin (Excl OI)",
          "val1": "15.28%",
          "val2": "14.73%",
          "chgp": "0.55%",
          "chgp_class": "positive"
        }
      ]
    }
  },
  {
    "link": "annual",
    "btn_text": "All Annual Results",
    "header": "Annual Results Snapshot (Consolidated) - Mar'26",
    "rhs": [
      {
        "prefix": "Net Sales ",
        "suffix": "YoY Growth in year ended Mar 2026 is 8.91% vs 18.81% in Mar 2025",
        "dir": -1
      },
      {
        "prefix": "Consolidated Net Profit ",
        "suffix": "YoY Growth in year ended Mar 2026 is 6.35% vs 17.58% in Mar 2025",
        "dir": -1
      }
    ],
    "table": {
      "header": [
        "Mar'26",
        "Mar'25",
        "Change(%)"
      ],
      "body": [
        {
          "field": "Net Sales",
          "val1": "425.10",
          "val2": "390.34",
          "chgp": "8.91%",
          "chgp_class": "positive"
        },
        {
          "field": "Operating Profit (PBDIT) excl Other Income",
          "val1": "66.87",
          "val2": "59.97",
          "chgp": "11.51%",
          "chgp_class": "positive"
        },
        {
          "field": "Interest",
          "val1": "0.35",
          "val2": "0.51",
          "chgp": "-31.37%",
          "chgp_class": "positive"
        },
        {
          "field": "Exceptional Items",
          "val1": "-3.51",
          "val2": "-5.45",
          "chgp": "35.60%",
          "chgp_class": "positive"
        },
        {
          "field": "Consolidate Net Profit",
          "val1": "53.62",
          "val2": "50.42",
          "chgp": "6.35%",
          "chgp_class": "positive"
        },
        {
          "field": "Operating Profit Margin (Excl OI)",
          "val1": "15.73%",
          "val2": "15.36%",
          "chgp": "0.37%",
          "chgp_class": "positive"
        }
      ]
    }
  }
]

Quarterly Results Snapshot (Consolidated) - Jun'26 - QoQstock-summary

Jun'26
Mar'26
Change(%)
Net Sales
87.16
90.81
-4.02%
Operating Profit (PBDIT) excl Other Income
12.61
15.78
-20.09%
Interest
0.27
0.01
2,600.00%
Exceptional Items
0.00
0.00
Consolidate Net Profit
10.58
13.18
-19.73%
Operating Profit Margin (Excl OI)
14.47%
17.38%
-2.91%
Values in Rs Cr.
Direction Arrows
Net Sales

QoQ Growth in quarter ended Jun 2026 is -4.02% vs -29.40% in Mar 2026

Direction Arrows
Consolidated Net Profit

QoQ Growth in quarter ended Jun 2026 is -19.73% vs -13.29% in Mar 2026

Half Yearly Results Snapshot (Consolidated) - Sep'25stock-summary

Sep'25
Sep'24
Change(%)
Net Sales
205.67
182.67
12.59%
Operating Profit (PBDIT) excl Other Income
29.34
29.37
-0.10%
Interest
0.25
0.28
-10.71%
Exceptional Items
0.00
0.00
Consolidate Net Profit
25.24
27.68
-8.82%
Operating Profit Margin (Excl OI)
14.27%
16.08%
-1.81%
Values in Rs Cr.
Direction Arrows
Net Sales

Growth in half year ended Sep 2025 is 12.59% vs 6.74% in Sep 2024

Direction Arrows
Consolidated Net Profit

Growth in half year ended Sep 2025 is -8.82% vs 15.48% in Sep 2024

Nine Monthly Results Snapshot (Consolidated) - Dec'25stock-summary

Dec'25
Dec'24
Change(%)
Net Sales
334.29
282.01
18.54%
Operating Profit (PBDIT) excl Other Income
51.09
41.55
22.96%
Interest
0.34
0.40
-15.00%
Exceptional Items
-3.51
-1.26
-178.57%
Consolidate Net Profit
40.44
37.70
7.27%
Operating Profit Margin (Excl OI)
15.28%
14.73%
0.55%
Values in Rs Cr.
Direction Arrows
Net Sales

YoY Growth in nine months ended Dec 2025 is 18.54% vs 21.46% in Dec 2024

Direction Arrows
Consolidated Net Profit

YoY Growth in nine months ended Dec 2025 is 7.27% vs 26.85% in Dec 2024

Annual Results Snapshot (Consolidated) - Mar'26stock-summary

Mar'26
Mar'25
Change(%)
Net Sales
425.10
390.34
8.91%
Operating Profit (PBDIT) excl Other Income
66.87
59.97
11.51%
Interest
0.35
0.51
-31.37%
Exceptional Items
-3.51
-5.45
35.60%
Consolidate Net Profit
53.62
50.42
6.35%
Operating Profit Margin (Excl OI)
15.73%
15.36%
0.37%
Values in Rs Cr.
Direction Arrows
Net Sales

YoY Growth in year ended Mar 2026 is 8.91% vs 18.81% in Mar 2025

Direction Arrows
Consolidated Net Profit

YoY Growth in year ended Mar 2026 is 6.35% vs 17.58% in Mar 2025

stock-summaryCompany CV
About Disa India Ltd stock-summary
stock-summary
Disa India Ltd
Small Cap
Industrial Manufacturing
Disa India Limited (formerly George Fisher Disa Limited), part of Cophenhagen based Disa A/S Group, manufactures foundry machinery like moulding plants, sand plants and shot blasting machines. Its Promoters are DISA Holding AG of Switzerland and DISA Holding A/S of Denmark and the Company's ultimate holding company is Norican Global A/S, Denmark. Established in May, 1984 as BMD Industries with technical and financial participation from BMD, Germany; Vulcan Laval, Germany and KSIIDC.
Company Coordinates stock-summary
Company Details
World Trade Center 6th Flr, Unit No S-604 26/1 Rajkumar Rd Bangalore Karnataka : 560055
stock-summary
Tel:
stock-summary
bangalore@noricangroup.com
Registrar Details
Integrated Enterprises (India) Ltd , 30, Ramana Residency, 4th Cross, Sampige Road, Malleswaram, Bangalore