
Compare S C I with Similar Stocks
Dashboard
Strong ability to service debt as the company has a low Debt to EBITDA ratio of 1.23 times
Positive results in Mar 26
With ROCE of 9.9, it has a Fair valuation with a 1.5 Enterprise value to Capital Employed
Increasing Participation by Institutional Investors
Market Beating performance in long term as well as near term
Stock DNA
Transport Services
INR 15,029 Cr (Small Cap)
11.00
10
4.02%
0.25
14.87%
1.65
Total Returns (Price + Dividend) 
Latest dividend: 3.511565999632825 per share ex-dividend date: Feb-17-2026
Risk Adjusted Returns v/s
Returns Beta

News
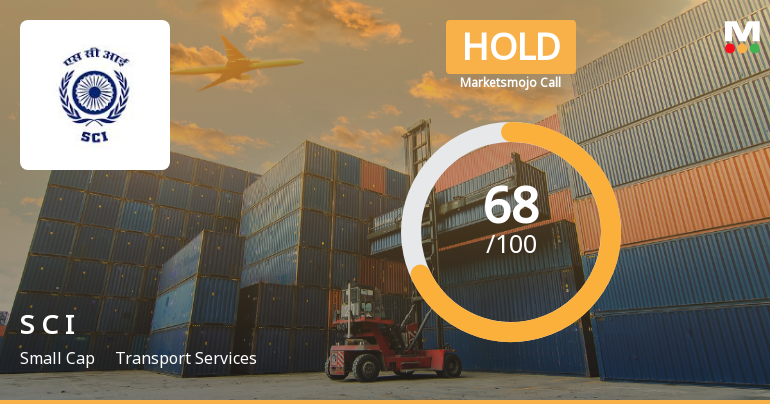
Shipping Corporation of India Ltd Downgraded to Hold Amid Valuation Concerns
Shipping Corporation of India Ltd (SCI), a key player in the transport services sector, has seen its investment rating downgraded from Buy to Hold as of 22 June 2026. The revision primarily stems from a reassessment of its valuation metrics, despite the company’s robust financial performance and strong technical indicators. This article analyses the four critical parameters—Quality, Valuation, Financial Trend, and Technicals—that influenced this change in rating.
Read full news article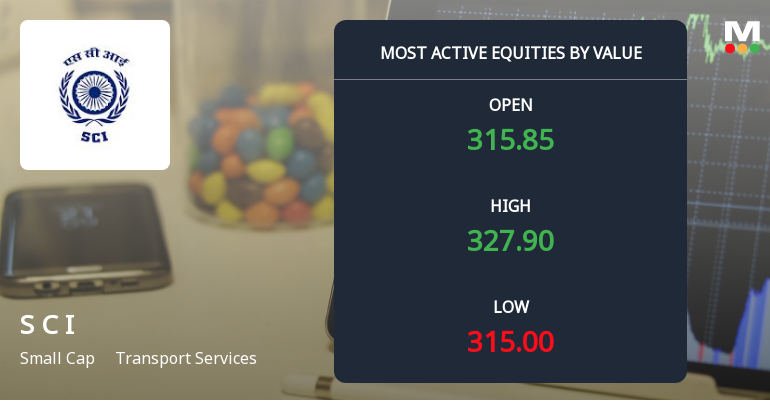
Shipping Corporation of India Ltd Sees Robust Trading Activity and Upgraded Mojo Grade
Shipping Corporation of India Ltd (SCI) has emerged as one of the most actively traded stocks by value on 22 June 2026, reflecting heightened investor interest and robust market participation. The stock outperformed its sector and broader benchmarks, supported by strong volume, institutional buying, and a recent upgrade in its mojo rating, signalling renewed confidence in its growth prospects within the transport services sector.
Read full news article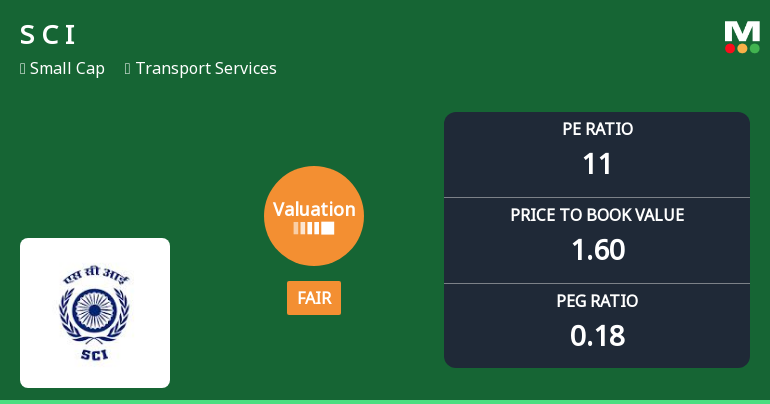
Shipping Corporation of India Ltd Valuation Shifts Signal Changing Market Sentiment
Shipping Corporation of India Ltd (SCI) has witnessed a notable change in its valuation parameters, moving from a very attractive to a fair valuation grade. Despite this shift, the stock continues to deliver robust returns, outperforming the Sensex significantly over multiple time horizons. This article analyses the recent valuation changes, compares SCI’s metrics with its peers, and assesses the implications for investors.
Read full news article Announcements
Closure of Trading Window
24-Jun-2026 | Source : BSEIntimation regarding closure of Trading Window for the first quarter ending 30.06.2026 for FY 2026-27
Announcement under Regulation 30 (LODR)-Change in Management
02-Jun-2026 | Source : BSEDisclosure under Regulation 30 of SEBI (Listing Obligations and Disclosure Requirements) Regulations 2015- Change in Management
Announcement under Regulation 30 (LODR)-Change in Management
01-Jun-2026 | Source : BSEDisclosure under Regulation 30 of SEBI (LODR) Regulations 2015- change in senior management
Corporate Actions

No Upcoming Board Meetings

Shipping Corporation of India Ltd has declared 35% dividend, ex-date: 17 Feb 26

No Splits history available

Shipping Corporation of India Ltd has announced 1:2 bonus issue, ex-date: 29 Oct 08

No Rights history available
Quality key factors
Valuation key factors
Technicals key factors
 Technical Indicator Scale: Bearish, Mildly Bearish, Sideways, Mildly Bullish, Bullish Turned
 Shareholding Snapshot : Mar 2026
Shareholding Compare (%holding)
Promoters
None
Held by 20 Schemes (0.6%)
Held by 146 FIIs (8.98%)
President Of India (63.75%)
Life Insurance Corporation Of India (1.06%)
20.94%
Quarterly Results Snapshot (Consolidated) - Mar'26 - QoQ

QoQ Growth in quarter ended Mar 2026 is -6.11% vs 20.38% in Dec 2025
QoQ Growth in quarter ended Mar 2026 is -0.09% vs 114.09% in Dec 2025
Half Yearly Results Snapshot (Consolidated) - Sep'25
Growth in half year ended Sep 2025 is -10.46% vs 29.29% in Sep 2024
Growth in half year ended Sep 2025 is -6.79% vs 145.61% in Sep 2024
Nine Monthly Results Snapshot (Consolidated) - Dec'25
YoY Growth in nine months ended Dec 2025 is -0.33% vs 17.79% in Dec 2024
YoY Growth in nine months ended Dec 2025 is 44.02% vs 77.15% in Dec 2024
Annual Results Snapshot (Consolidated) - Mar'26
YoY Growth in year ended Mar 2026 is 3.10% vs 11.08% in Mar 2025

YoY Growth in year ended Mar 2026 is 60.38% vs 24.24% in Mar 2025
About Shipping Corporation of India Ltd

Company Coordinates


