
Compare Shadowfax Techno with Similar Stocks
Stock DNA
Transport Services
INR 12,982 Cr (Mid Cap)
127.00
39
0.00%
-0.45
6.59%
6.82
Total Returns (Price + Dividend) 
Shadowfax Techno for the last several years.
Risk Adjusted Returns v/s
Returns Beta

News
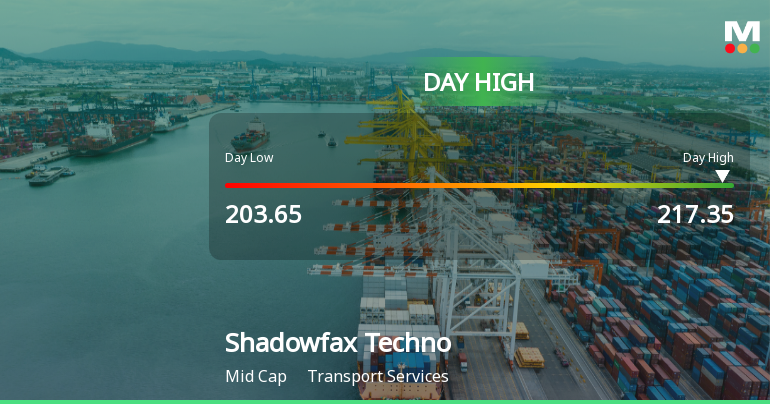
Shadowfax Technologies Ltd Surges 5.18% to Day's High of Rs 214.4 — Outperforms Sector by 4.25 Percentage Points
The Sensex climbed 0.92% on 17 Jul 2026, yet Shadowfax Technologies Ltd outpaced the broader market with a 5.18% gain, reaching an intraday high of Rs 214.4. This 4.25-percentage-point outperformance over its Transport Services sector peers signals a distinctly stock-specific rally rather than a market-wide lift.
Read full news article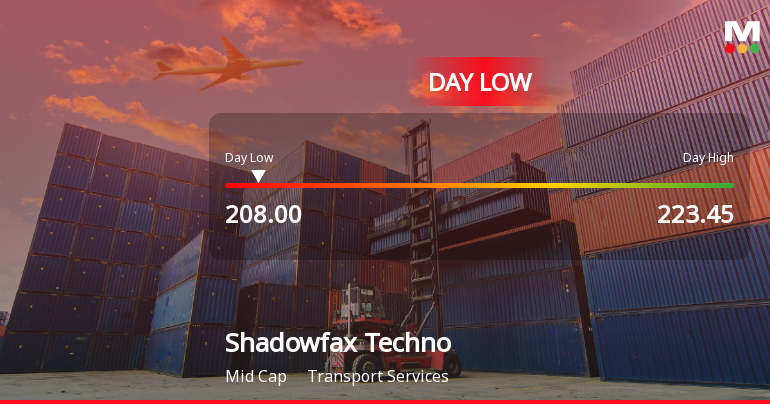
Shadowfax Technologies Ltd Hits Intraday Low Amid Price Pressure
Shadowfax Technologies Ltd experienced a notable decline today, touching an intraday low of Rs 208, reflecting a 6.66% drop as the stock faced significant price pressure amid broader market weakness and sector underperformance.
Read full news article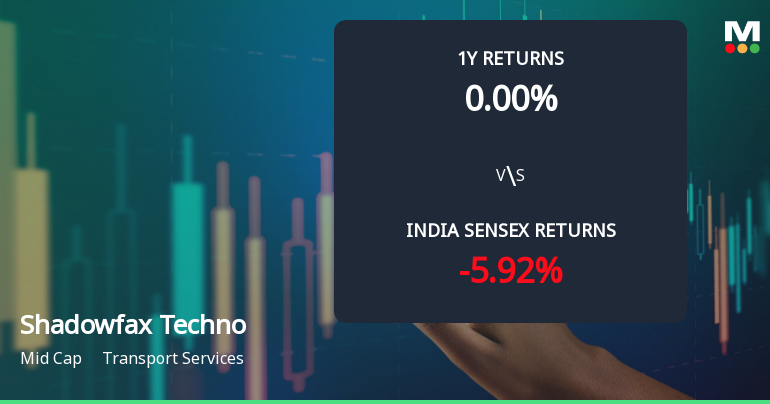
Shadowfax Technologies Ltd Faces Technical Momentum Shift Amid Market Volatility
Shadowfax Technologies Ltd, a mid-cap player in the transport services sector, has experienced a notable shift in its technical momentum, moving from a mildly bullish stance to a sideways trend. This change comes amid a 2.24% decline in its share price on 14 Jul 2026, reflecting growing investor caution despite the company’s recent performance relative to the broader market.
Read full news article Announcements
Clarification sought from Shadowfax Technologies Ltd
14-Jul-2026 | Source : BSEThe Exchange has sought clarification from Shadowfax Technologies Ltd on July 14 2026 with reference to news appeared in https://www.moneycontrol.com/ dated July 13 2026 quoting Flipkart likely to sell stake worth Rs 700 crore in Shadowfax Technologies.
The reply is awaited.
Rumour verification - Regulation 30(11)
14-Jul-2026 | Source : BSEClarification/Confirmation on news item appearing in https://www.moneycontrol.com
Compliances-Certificate under Reg. 74 (5) of SEBI (DP) Regulations 2018
06-Jul-2026 | Source : BSECertificate under Regulation 74(5) of SEBI (Depositories and Participants) Regulations 2018 for the quarter ended June 30 2026
Corporate Actions

No Upcoming Board Meetings

No Dividend history available

No Splits history available

No Bonus history available

No Rights history available
Quality key factors
Valuation key factors
Technicals key factors
 Technical Indicator Scale: Bearish, Mildly Bearish, Sideways, Mildly Bullish, Bullish Turned
 Shareholding Snapshot : Mar 2026
Shareholding Compare (%holding)
Non Institution
None
Held by 10 Schemes (12.49%)
Held by 27 FIIs (7.65%)
Abhishek Bansal (9.33%)
Newquest Asia Fund Iv Singapore Pte Ltd (11.59%)
7.81%
Quarterly Results Snapshot (Standalone) - Mar'26 - QoQ

QoQ Growth in quarter ended Mar 2026 is 6.88% vs 18.69% in Dec 2025
QoQ Growth in quarter ended Mar 2026 is 51.30% vs 156.71% in Dec 2025
Half Yearly Results Snapshot (Consolidated) - Sep'25
Not Applicable: The company has declared_date for only one period
Not Applicable: The company has declared_date for only one period
Nine Monthly Results Snapshot (Consolidated) - Dec'25
Not Applicable: The company has declared_date for only one period
Not Applicable: The company has declared_date for only one period
Annual Results Snapshot (Consolidated) - Mar'26

YoY Growth in year ended Mar 2026 is 69.10% vs 31.85% in Mar 2025
YoY Growth in year ended Mar 2026 is 1,637.33% vs 154.12% in Mar 2025
About Shadowfax Technologies Ltd

Company Coordinates


