
Compare Delhivery with Similar Stocks
Dashboard
Poor Management Efficiency with a low ROE of 0.72%
- The company has been able to generate a Return on Equity (avg) of 0.72% signifying low profitability per unit of shareholders funds
The company is Net-Debt Free
Healthy long term growth as Operating profit has grown by an annual rate 18.15%
Positive results in Mar 26
Risky - Negative Operating Profits
High Institutional Holdings at 84.49%
Stock DNA
Transport Services
INR 36,304 Cr (Small Cap)
200.00
37
0.00%
-0.05
1.84%
3.74
Total Returns (Price + Dividend) 
Delhivery for the last several years.
Risk Adjusted Returns v/s
Returns Beta

News

Delhivery Ltd Sees Sharp Open Interest Surge Amid Strong Price Momentum
Delhivery Ltd, a key player in the Transport Services sector, has witnessed a significant surge in open interest (OI) in its derivatives segment, signalling heightened market activity and potential directional bets. The stock’s recent price action, combined with a 31.7% jump in OI, suggests renewed investor interest amid a backdrop of strong technical and fundamental cues.
Read full news article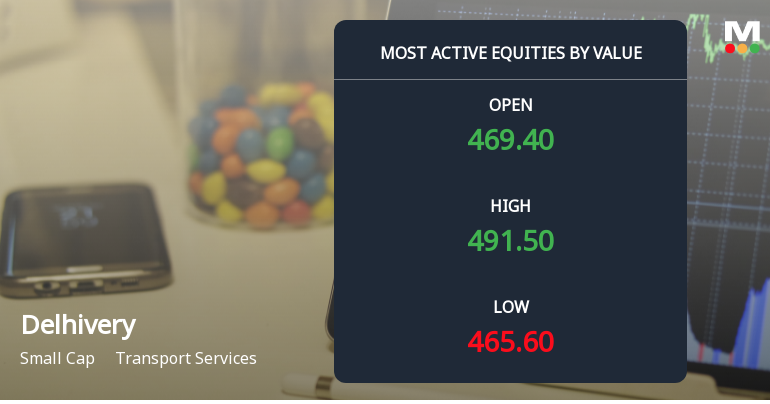
Delhivery Ltd Surges on High-Value Trading and Institutional Interest
Delhivery Ltd, a prominent player in the transport services sector, witnessed robust trading activity on 22 June 2026, marked by a significant surge in value turnover and sustained institutional interest. The stock outperformed its sector peers and broader market indices, reflecting renewed investor confidence and positive momentum in the logistics space.
Read full news article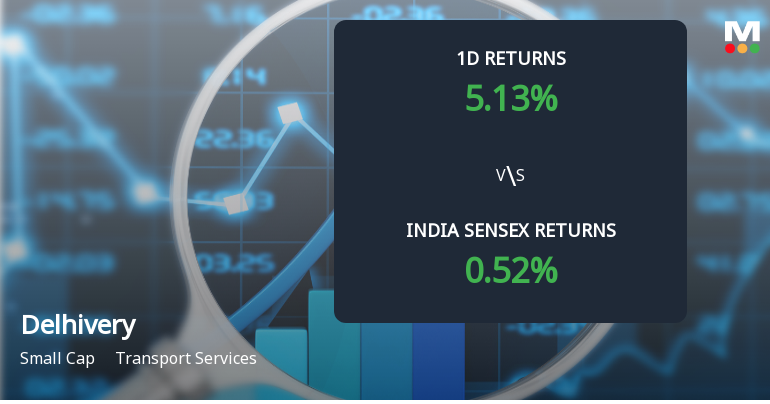
Delhivery Ltd Sees Sharp Open Interest Surge Amid Strong Price Momentum
Delhivery Ltd, a prominent player in the transport services sector, has witnessed a significant surge in open interest (OI) in its derivatives segment, signalling heightened market activity and shifting investor positioning. The stock has concurrently hit a new 52-week high, reflecting robust bullish sentiment amid improving fundamentals and sectoral tailwinds.
Read full news article Announcements
Grant Of Stock Options
19-Jun-2026 | Source : BSEGrant of 187375 stock options under Delhivery Employees Stock Option Plan IV 2021
Press Release
19-Jun-2026 | Source : BSEDelhivery Launches Delhivery Maps - Indias first AI-native Mapping Suite built on Commercial Logistics Telemetry
Announcement under Regulation 30 (LODR)-Newspaper Publication
10-Jun-2026 | Source : BSENewspaper Extracts of the Postal Ballot Advertisement
Corporate Actions

No Upcoming Board Meetings

No Dividend history available

No Splits history available

No Bonus history available

No Rights history available
Quality key factors
Valuation key factors
Technicals key factors
 Technical Indicator Scale: Bearish, Mildly Bearish, Sideways, Mildly Bullish, Bullish Turned
 Shareholding Snapshot : Mar 2026
Shareholding Compare (%holding)
FIIs
None
Held by 36 Schemes (33.16%)
Held by 293 FIIs (48.22%)
None
Svf Doorbell (cayman) Ltd (8.15%)
5.56%
Quarterly Results Snapshot (Consolidated) - Mar'26 - QoQ

QoQ Growth in quarter ended Mar 2026 is 1.60% vs 9.60% in Dec 2025
QoQ Growth in quarter ended Mar 2026 is 82.78% vs 178.62% in Dec 2025
Half Yearly Results Snapshot (Consolidated) - Sep'25
Growth in half year ended Sep 2025 is 11.26% vs 12.67% in Sep 2024
Growth in half year ended Sep 2025 is -37.00% vs 133.55% in Sep 2024
Nine Monthly Results Snapshot (Consolidated) - Dec'25

YoY Growth in nine months ended Dec 2025 is 13.62% vs 11.12% in Dec 2024
YoY Growth in nine months ended Dec 2025 is -10.35% vs 149.55% in Dec 2024
Annual Results Snapshot (Consolidated) - Mar'26
YoY Growth in year ended Mar 2026 is 17.65% vs 9.71% in Mar 2025
YoY Growth in year ended Mar 2026 is -5.82% vs 165.05% in Mar 2025
About Delhivery Ltd

Company Coordinates


