
Compare Container Corpn. with Similar Stocks
Stock DNA
Transport Services
INR 35,419 Cr (Mid Cap)
28.00
39
1.66%
-0.19
9.59%
2.70
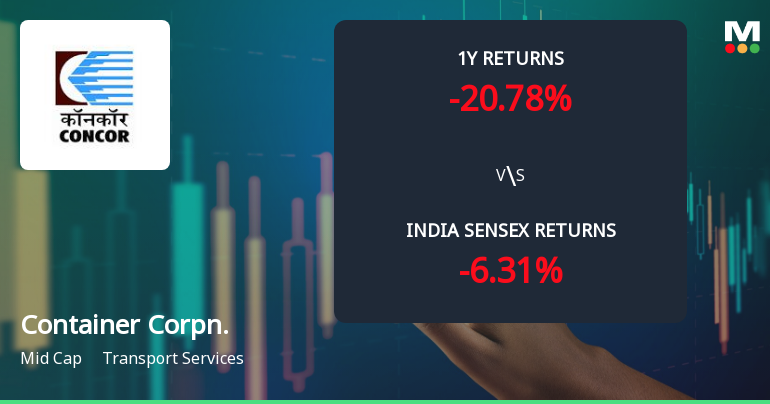
Total Returns (Price + Dividend) 
Latest dividend: 3.4023185582075013 per share ex-dividend date: Feb-09-2026
Risk Adjusted Returns v/s
Returns Beta

News
Container Corporation Of India Ltd Faces Bearish Momentum Amid Technical Downturn
Container Corporation Of India Ltd (stock ID: 336884) has experienced a notable shift in its technical momentum, with key indicators signalling a bearish trend. Despite a mid-cap market capitalisation and a recent downgrade in its Mojo Grade from Strong Sell to Sell, the stock’s price action and technical parameters warrant close scrutiny for investors navigating the transport services sector.
Read full news article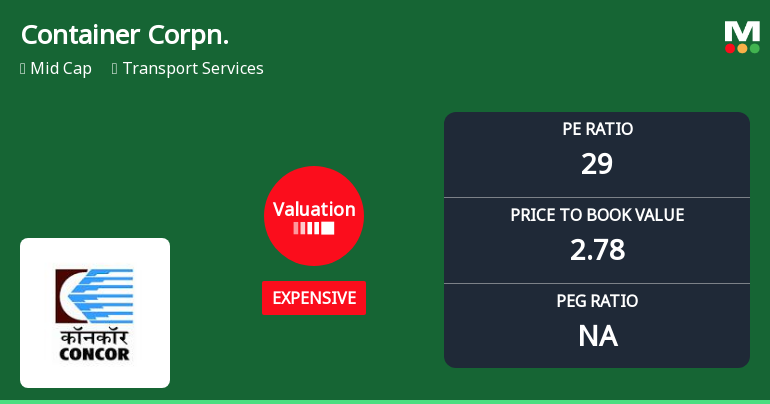
Container Corporation of India Ltd: Valuation Shift Signals Price Attractiveness Change
Container Corporation Of India Ltd (NSE: 336884) has experienced a notable shift in its valuation parameters, moving from a very expensive to an expensive rating. This change reflects evolving market perceptions and impacts the stock’s price attractiveness amid a challenging transport services sector backdrop.
Read full news article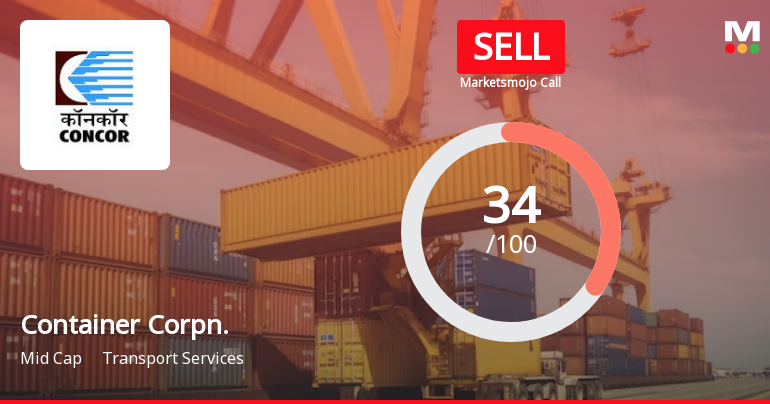
Container Corporation Of India Ltd is Rated Sell
Container Corporation Of India Ltd is rated 'Sell' by MarketsMOJO. This rating was last updated on 01 June 2026, reflecting a shift from a previous 'Strong Sell' stance. However, the analysis and financial metrics discussed here represent the stock's current position as of 05 July 2026, providing investors with the latest insights into its performance and outlook.
Read full news article Announcements
Container Corporation Of India Limited - Analysts/Institutional Investor Meet/Con. Call Updates
03-Dec-2019 | Source : NSEContainer Corporation Of India Limiteded has informed the Exchange regarding Analysts/Institutional Investor Meet/Con. Call Updates
Container Corporation Of India Limited - Other General Purpose
27-Nov-2019 | Source : NSEContainer Corporation Of India Limited has informed the Exchange that Disclosure of Related Party Transaction under Regulation 23(9) of SEBI (LODR) Regulations
Container Corporation Of India Limited - Analysts/Institutional Investor Meet/Con. Call Updates
21-Nov-2019 | Source : NSEContainer Corporation Of India Limiteded has informed the Exchange regarding Analysts/Institutional Investor Meet/Con. Call Updates
Corporate Actions

24 Jul 2026

Container Corporation Of India Ltd has declared 68% dividend, ex-date: 09 Feb 26

Container Corporation Of India Ltd has announced 5:10 stock split, ex-date: 26 Jun 18

Container Corporation Of India Ltd has announced 1:4 bonus issue, ex-date: 04 Jul 25

No Rights history available
Quality key factors
Valuation key factors
Technicals key factors
 Technical Indicator Scale: Bearish, Mildly Bearish, Sideways, Mildly Bullish, Bullish Turned
 Shareholding Snapshot : Mar 2026
Shareholding Compare (%holding)
Promoters
None
Held by 34 Schemes (13.91%)
Held by 231 FIIs (8.32%)
President Of India Ministry Of Railways (54.8%)
Life Insurance Corporation Of India (10.04%)
5.96%
Quarterly Results Snapshot (Consolidated) - Mar'26 - YoY

YoY Growth in quarter ended Mar 2026 is -1.07% vs -1.60% in Mar 2025

YoY Growth in quarter ended Mar 2026 is -12.39% vs -5.41% in Mar 2025
Half Yearly Results Snapshot (Consolidated) - Sep'25
Growth in half year ended Sep 2025 is 2.67% vs 6.63% in Sep 2024
Growth in half year ended Sep 2025 is 3.48% vs 1.74% in Sep 2024
Nine Monthly Results Snapshot (Consolidated) - Dec'25
YoY Growth in nine months ended Dec 2025 is 3.28% vs 4.28% in Dec 2024
YoY Growth in nine months ended Dec 2025 is -1.12% vs 4.93% in Dec 2024
Annual Results Snapshot (Consolidated) - Mar'26
YoY Growth in year ended Mar 2026 is 2.16% vs 2.70% in Mar 2025
YoY Growth in year ended Mar 2026 is -3.74% vs 2.33% in Mar 2025
About Container Corporation Of India Ltd

Company Coordinates


