
Compare Delhivery with Similar Stocks
Dashboard
Poor Management Efficiency with a low ROE of 0.72%
- The company has been able to generate a Return on Equity (avg) of 0.72% signifying low profitability per unit of shareholders funds
The company is Net-Debt Free
Healthy long term growth as Operating profit has grown by an annual rate 18.15%
Positive results in Mar 26
Risky - Negative Operating Profits
High Institutional Holdings at 84.49%
Stock DNA
Transport Services
INR 38,641 Cr (Small Cap)
218.00
39
0.00%
-0.05
1.84%
3.99
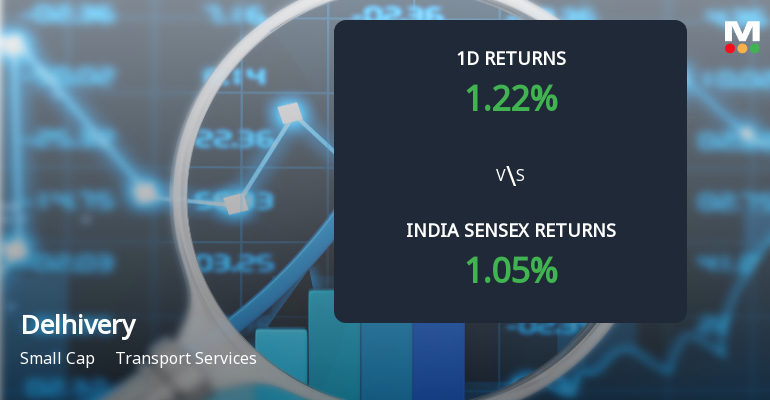
Total Returns (Price + Dividend) 
Delhivery for the last several years.
Risk Adjusted Returns v/s
Returns Beta

News
Delhivery Ltd Sees Sharp Open Interest Surge Amid Rising Market Momentum
Delhivery Ltd, a key player in the transport services sector, has witnessed a significant surge in open interest in its derivatives segment, signalling heightened investor interest and potential directional bets. The stock recently hit a new 52-week high of Rs. 524, supported by rising volumes and improving technical indicators, reflecting a positive shift in market positioning.
Read full news article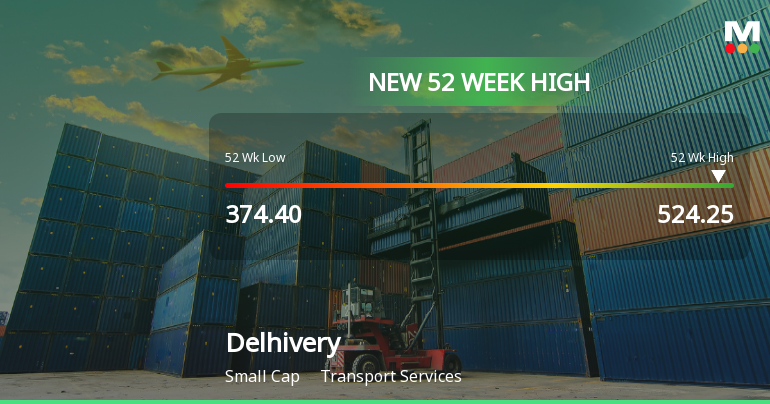
Broad-Based Technical Strength Lifts Delhivery Ltd to 52-Week High of Rs 524.25
Surging to a fresh 52-week high of Rs 524.25 on 10 Jul 2026, Delhivery Ltd has demonstrated robust price momentum, outpacing the broader market with a 24.35% gain over the past year compared to the Sensex’s decline of 6.79%.
Read full news article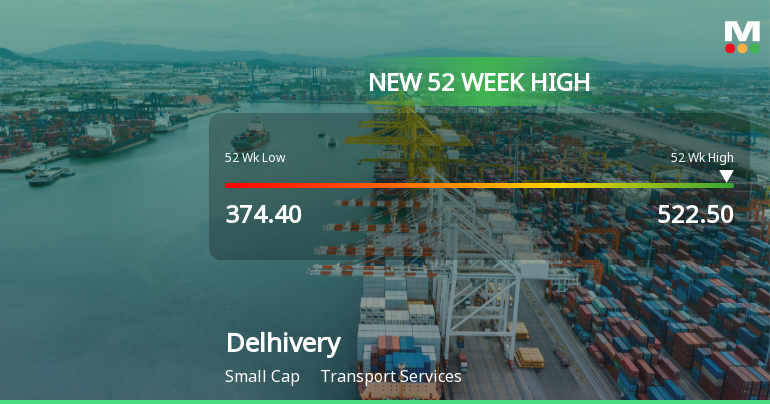
Broad-Based Technical Strength Lifts Delhivery Ltd to 52-Week High of Rs 522.2
With a steady climb from Rs 374.4 to a fresh 52-week high of Rs 522.2, Delhivery Ltd has outpaced the Sensex by nearly 38 percentage points over the past year, showcasing robust momentum amid a broadly positive market backdrop.
Read full news article Announcements
Corporate Actions

No Upcoming Board Meetings

No Dividend history available

No Splits history available

No Bonus history available

No Rights history available
Quality key factors
Valuation key factors
Technicals key factors
 Technical Indicator Scale: Bearish, Mildly Bearish, Sideways, Mildly Bullish, Bullish Turned
 Shareholding Snapshot : Mar 2026
Shareholding Compare (%holding)
FIIs
None
Held by 36 Schemes (33.16%)
Held by 293 FIIs (48.22%)
None
Svf Doorbell (cayman) Ltd (8.15%)
5.56%
Quarterly Results Snapshot (Consolidated) - Mar'26 - QoQ

QoQ Growth in quarter ended Mar 2026 is 1.60% vs 9.60% in Dec 2025
QoQ Growth in quarter ended Mar 2026 is 82.78% vs 178.62% in Dec 2025
Half Yearly Results Snapshot (Consolidated) - Sep'25
Growth in half year ended Sep 2025 is 11.26% vs 12.67% in Sep 2024
Growth in half year ended Sep 2025 is -37.00% vs 133.55% in Sep 2024
Nine Monthly Results Snapshot (Consolidated) - Dec'25

YoY Growth in nine months ended Dec 2025 is 13.62% vs 11.12% in Dec 2024
YoY Growth in nine months ended Dec 2025 is -10.35% vs 149.55% in Dec 2024
Annual Results Snapshot (Consolidated) - Mar'26
YoY Growth in year ended Mar 2026 is 17.65% vs 9.71% in Mar 2025
YoY Growth in year ended Mar 2026 is -5.82% vs 165.05% in Mar 2025
About Delhivery Ltd

Company Coordinates


