
Compare 20 Microns with Similar Stocks
Dashboard
Strong ability to service debt as the company has a low Debt to EBITDA ratio of 1.27 times
Poor long term growth as Net Sales has grown by an annual rate of 14.55% and Operating profit at 18.11% over the last 5 years
Positive results in Mar 26
With ROCE of 18.4, it has a Very Attractive valuation with a 1.3 Enterprise value to Capital Employed
Despite the size of the company, domestic mutual funds hold only 0% of the company
Stock DNA
Minerals & Mining
INR 738 Cr (Micro Cap)
10.00
11
0.66%
0.15
13.88%
1.38
Total Returns (Price + Dividend) 
Latest dividend: 1.25 per share ex-dividend date: Jul-24-2025
Risk Adjusted Returns v/s
Returns Beta

News

20 Microns Ltd is Rated Hold by MarketsMOJO
20 Microns Ltd is rated 'Hold' by MarketsMOJO, with this rating last updated on 22 May 2026. However, the analysis and financial metrics discussed here reflect the stock's current position as of 20 June 2026, providing investors with an up-to-date view of the company’s fundamentals, valuation, financial trends, and technical outlook.
Read full news article
20 Microns Ltd is Rated Hold
20 Microns Ltd is rated 'Hold' by MarketsMOJO, with this rating last updated on 22 May 2026. However, the analysis and financial metrics discussed below reflect the company’s current position as of 09 June 2026, providing investors with the latest insights into its performance and outlook.
Read full news article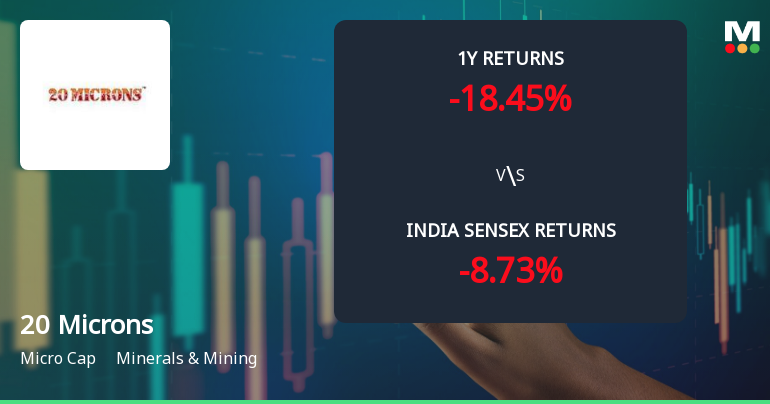
20 Microns Ltd Technical Momentum Shifts Amid Mixed Market Signals
Shares of 20 Microns Ltd, a micro-cap player in the Minerals & Mining sector, have experienced a notable shift in technical momentum, reflecting a complex interplay of bullish and bearish signals across key indicators. Despite a recent downgrade in price momentum from sideways to mildly bearish, the stock’s long-term performance remains robust, prompting a reassessment of its technical outlook and investment potential.
Read full news article Announcements
Incorporation Of Overseas Step-Down Subsidiary In The PeopleS Republic Of China
15-Jun-2026 | Source : BSEIncorporation of Overseas Step-down Subsidiary in the Peoples Republic of China
We Are Enclosing Herewith An Intimation Regarding Communication To Shareholders - Intimation On Tax Deduction On Dividend.
09-Jun-2026 | Source : BSEwe are enclosing herewith an intimation regarding communication to Shareholders - Intimation on Tax Deduction on Dividend
Announcement under Regulation 30 (LODR)-Earnings Call Transcript
30-May-2026 | Source : BSETranscript of Earning call for the Quarter and Year Ended March 312026
Corporate Actions

No Upcoming Board Meetings

20 Microns Ltd has declared 25% dividend, ex-date: 17 Jul 26

20 Microns Ltd has announced 5:10 stock split, ex-date: 28 Jan 13

No Bonus history available

No Rights history available
Quality key factors
Valuation key factors
Technicals key factors
 Technical Indicator Scale: Bearish, Mildly Bearish, Sideways, Mildly Bullish, Bullish Turned
 Shareholding Snapshot : Mar 2026
Shareholding Compare (%holding)
Non Institution
None
Held by 0 Schemes
Held by 6 FIIs (0.41%)
Ionix Advanced Materials Private Limited (24.56%)
Viking Industries Private Limited (4.19%)
41.73%
Quarterly Results Snapshot (Consolidated) - Mar'26 - QoQ

QoQ Growth in quarter ended Mar 2026 is 21.52% vs -6.92% in Dec 2025
QoQ Growth in quarter ended Mar 2026 is 17.78% vs -14.02% in Dec 2025
Half Yearly Results Snapshot (Consolidated) - Sep'25

Growth in half year ended Sep 2025 is 1.53% vs 20.62% in Sep 2024
Growth in half year ended Sep 2025 is 0.06% vs 10.76% in Sep 2024
Nine Monthly Results Snapshot (Consolidated) - Dec'25
YoY Growth in nine months ended Dec 2025 is 1.08% vs 21.27% in Dec 2024
YoY Growth in nine months ended Dec 2025 is 4.43% vs 11.17% in Dec 2024
Annual Results Snapshot (Consolidated) - Mar'26
YoY Growth in year ended Mar 2026 is 4.50% vs 17.40% in Mar 2025
YoY Growth in year ended Mar 2026 is 7.13% vs 11.25% in Mar 2025
About 20 Microns Ltd

Company Coordinates


