
Compare MOIL with Similar Stocks
Stock DNA
Minerals & Mining
INR 5,558 Cr (Small Cap)
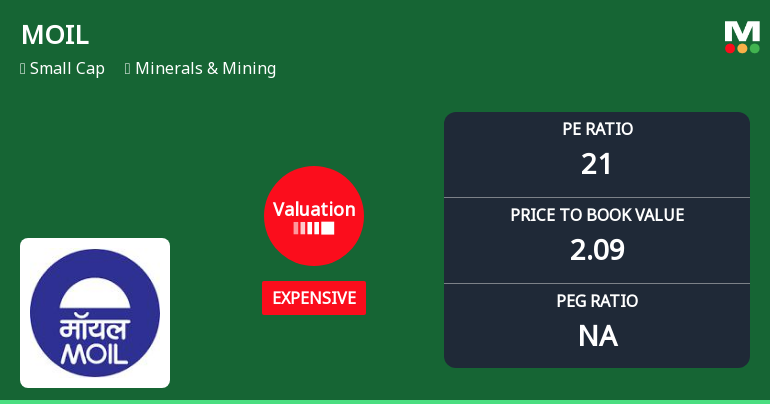
21.00
10
2.50%
-0.37
9.90%
2.08
Total Returns (Price + Dividend) 
Latest dividend: 3.5000000000000004 per share ex-dividend date: Feb-05-2026
Risk Adjusted Returns v/s
Returns Beta

News
MOIL Ltd. Valuation Shift Signals Price Attractiveness Amid Mixed Returns
MOIL Ltd., a key player in the Minerals & Mining sector, has experienced a notable shift in its valuation parameters, moving from a very expensive to an expensive rating. This change, coupled with its recent market performance and peer comparisons, offers investors a nuanced perspective on the stock’s price attractiveness and potential investment merit.
Read full news article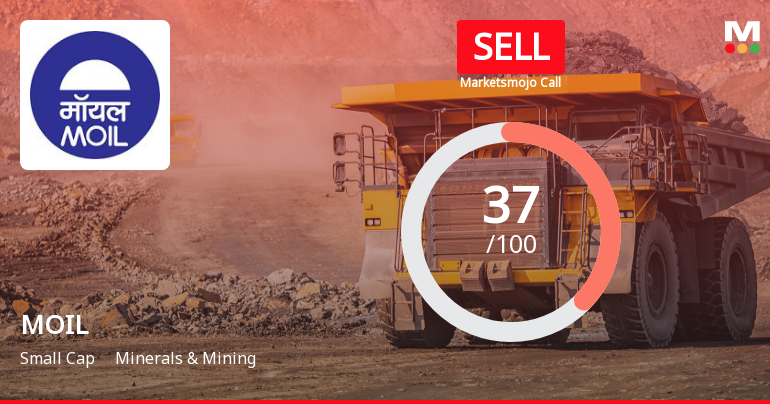
MOIL Ltd. is Rated Sell by MarketsMOJO
MOIL Ltd. is rated 'Sell' by MarketsMOJO, with this rating last updated on 10 April 2026. However, the analysis and financial metrics discussed here reflect the stock's current position as of 30 June 2026, providing investors with an up-to-date view of the company’s performance and outlook.
Read full news article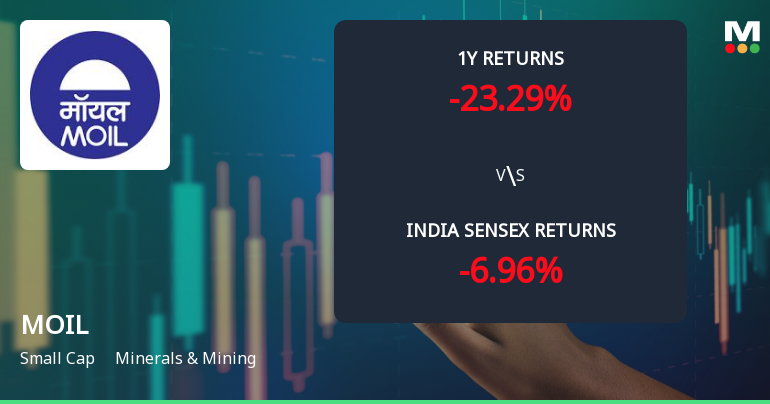
MOIL Ltd. Technical Momentum Shifts Amid Bearish Signals
MOIL Ltd., a key player in the Minerals & Mining sector, has experienced a notable shift in its technical momentum, moving from a mildly bearish stance to a more pronounced bearish trend. This change is underscored by deteriorating technical indicators including MACD, Bollinger Bands, and moving averages, signalling increased selling pressure and subdued investor sentiment as the stock trades near its 52-week lows.
Read full news article Announcements
MOIL Limited - Record Date
18-Nov-2019 | Source : NSEMOIL Limited has informed the Exchange that the Company has fixed Record Date as November 27, 2019 for the purpose of Buyback of equity shares
MOIL Limited - Outcome of Board Meeting
15-Nov-2019 | Source : NSEMOIL Limited has informed the Exchange regarding Board meeting held on November 14, 2019.
MOIL Limited - Updates
04-Nov-2019 | Source : NSEMOIL Limited has informed the Exchange regarding 'Information relating to fixation of prices of different grades of Manganese Ore and other products, for 3rd Quarter 2019-20 (Oct-Dec, 2019) effective from 01.11.2019.'.
Corporate Actions

No Upcoming Board Meetings

MOIL Ltd. has declared 35% dividend, ex-date: 05 Feb 26

No Splits history available

MOIL Ltd. has announced 1:1 bonus issue, ex-date: 27 Sep 17

No Rights history available
Quality key factors
Valuation key factors
Technicals key factors
 Technical Indicator Scale: Bearish, Mildly Bearish, Sideways, Mildly Bullish, Bullish Turned
 Shareholding Snapshot : Mar 2026
Shareholding Compare (%holding)
Promoters
None
Held by 9 Schemes (2.44%)
Held by 99 FIIs (4.17%)
President Of India (53.35%)
Life Insurance Corporation Of India (3.47%)
19.79%
Quarterly Results Snapshot (Standalone) - Mar'26 - QoQ

QoQ Growth in quarter ended Mar 2026 is 27.90% vs -0.15% in Dec 2025
QoQ Growth in quarter ended Mar 2026 is 75.00% vs -24.87% in Dec 2025
Half Yearly Results Snapshot (Standalone) - Sep'25

Growth in half year ended Sep 2025 is -11.29% vs 7.91% in Sep 2024
Growth in half year ended Sep 2025 is -39.73% vs 36.61% in Sep 2024
Nine Monthly Results Snapshot (Standalone) - Dec'25
YoY Growth in nine months ended Dec 2025 is -9.37% vs 11.42% in Dec 2024
YoY Growth in nine months ended Dec 2025 is -34.26% vs 31.55% in Dec 2024
Annual Results Snapshot (Standalone) - Mar'26
YoY Growth in year ended Mar 2026 is -7.07% vs 9.35% in Mar 2025
YoY Growth in year ended Mar 2026 is -29.91% vs 30.10% in Mar 2025
About MOIL Ltd.

Company Coordinates


