
Compare A B Infrabuild with Similar Stocks
Total Returns (Price + Dividend) 
A B Infrabuild for the last several years.
Risk Adjusted Returns v/s
Returns Beta

News

A B Infrabuild Ltd is Rated Sell
A B Infrabuild Ltd is rated Sell by MarketsMOJO. This rating was last updated on 02 Mar 2026, reflecting a shift from a previous Hold stance. However, the analysis and financial metrics presented here are based on the company’s current position as of 24 July 2026, providing investors with the latest insights into the stock’s performance and outlook.
Read full news article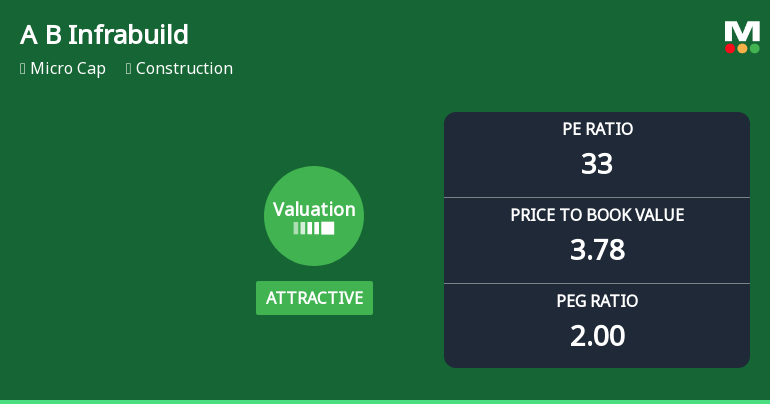
A B Infrabuild Ltd Valuation Shifts Signal Renewed Price Attractiveness Amid Market Challenges
A B Infrabuild Ltd, a micro-cap player in the construction sector, has recently seen a notable shift in its valuation parameters, moving from a fair to an attractive valuation grade. Despite a challenging year-to-date return of -43.9%, the company’s price-to-earnings (P/E) and price-to-book value (P/BV) ratios suggest a more compelling price point relative to its historical and peer averages, prompting a reassessment of its market appeal.
Read full news article
A B Infrabuild Ltd Valuation Shifts Signal Renewed Price Attractiveness Amid Sector Challenges
A B Infrabuild Ltd, a micro-cap player in the construction sector, has seen a notable shift in its valuation parameters, moving from a fair to an attractive rating. Despite a challenging market environment and significant underperformance relative to the Sensex, the company’s current price-to-earnings (P/E) and price-to-book value (P/BV) ratios suggest a more compelling entry point for investors seeking value in the construction space.
Read full news article Announcements
Compliances-Certificate under Reg. 74 (5) of SEBI (DP) Regulations 2018
13-Jul-2026 | Source : BSECertificate under Regulation 74 (5) of SEBI (DP) Regulations 2018.
Closure of Trading Window
30-Jun-2026 | Source : BSEClosure of Trading Window
Announcement under Regulation 30 (LODR)-Newspaper Publication
29-May-2026 | Source : BSENewspaper Publication
Corporate Actions

No Upcoming Board Meetings


A B Infrabuild Ltd has announced 1:10 stock split, ex-date: 17 Oct 25

No Bonus history available

A B Infrabuild Ltd has announced 1:5 rights issue, ex-date: 10 Mar 25
Quality key factors
Valuation key factors
Technicals key factors
 Technical Indicator Scale: Bearish, Mildly Bearish, Sideways, Mildly Bullish, Bullish Turned
 Shareholding Snapshot : Jun 2026
Shareholding Compare (%holding)
Non Institution
None
Held by 0 Schemes
Held by 2 FIIs (0.01%)
Amit Bholanath Mishra (23.66%)
Hitesh Natwarlal Kawa (6.31%)
44.05%
Quarterly Results Snapshot (Standalone) - Mar'26 - QoQ

QoQ Growth in quarter ended Mar 2026 is 12.79% vs 99.49% in Dec 2025
QoQ Growth in quarter ended Mar 2026 is -2.45% vs 187.32% in Dec 2025
Half Yearly Results Snapshot (Standalone) - Sep'25

Growth in half year ended Sep 2025 is 59.45% vs -19.10% in Sep 2024
Growth in half year ended Sep 2025 is 75.97% vs -6.58% in Sep 2024
Nine Monthly Results Snapshot (Standalone) - Dec'25
YoY Growth in nine months ended Dec 2025 is 26.29% vs -14.82% in Dec 2024
YoY Growth in nine months ended Dec 2025 is 42.39% vs -3.79% in Dec 2024
Annual Results Snapshot (Standalone) - Mar'26
YoY Growth in year ended Mar 2026 is 23.08% vs 13.25% in Mar 2025
YoY Growth in year ended Mar 2026 is 19.98% vs 41.16% in Mar 2025
About A B Infrabuild Ltd

Company Coordinates


