
Compare Aarey Drugs with Similar Stocks
Dashboard
Weak Long Term Fundamental Strength with an average Return on Capital Employed (ROCE) of 2.62%
- Poor long term growth as Net Sales has grown by an annual rate of 7.24% and Operating profit at 3.09% over the last 5 years
- Company's ability to service its debt is weak with a poor EBIT to Interest (avg) ratio of 1.55
The company has declared positive results in Mar'2026 after 4 consecutive negative quarters
With ROCE of 2.2, it has a Attractive valuation with a 1.5 Enterprise value to Capital Employed
Reducing Promoter Confidence
Stock DNA
Pharmaceuticals & Biotechnology
INR 247 Cr (Micro Cap)
54.00
23
0.00%
0.32
3.00%
1.64
Total Returns (Price + Dividend) 
Latest dividend: 0.1 per share ex-dividend date: Dec-13-2018
Risk Adjusted Returns v/s
Returns Beta

News

Aarey Drugs & Pharmaceuticals Ltd is Rated Hold
Aarey Drugs & Pharmaceuticals Ltd is rated 'Hold' by MarketsMOJO, with this rating last updated on 01 June 2026. However, the analysis and financial metrics discussed here reflect the stock's current position as of 04 July 2026, providing investors with the latest insights into the company’s performance and outlook.
Read full news article
Aarey Drugs & Pharmaceuticals Ltd is Rated Hold
Aarey Drugs & Pharmaceuticals Ltd is rated 'Hold' by MarketsMOJO, with this rating last updated on 01 June 2026. However, the analysis and financial metrics discussed here reflect the stock's current position as of 23 June 2026, providing investors with an up-to-date perspective on the company’s performance and outlook.
Read full news article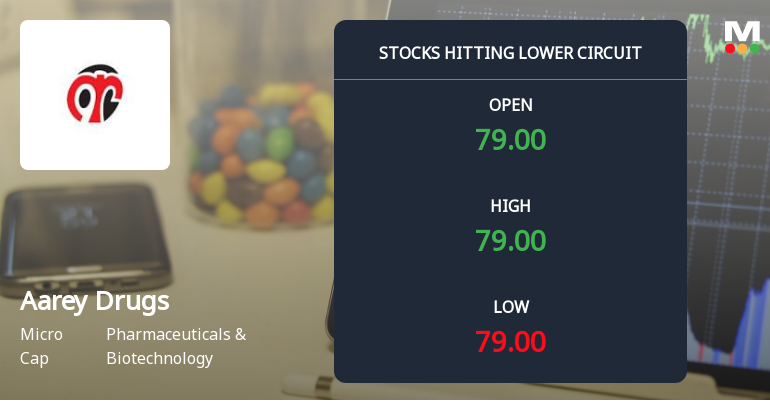
Aarey Drugs & Pharmaceuticals Ltd Locks at Lower Circuit With 5% Loss — Sellers Queue, No Buyers in Sight
At Rs 75.39, sellers were still queuing — but there were no buyers willing to take the other side. Aarey Drugs & Pharmaceuticals Ltd locked at its lower circuit of 5% on 16 Jun 2026, with unfilled sell orders and a frozen price, signalling a day dominated by supply overwhelming demand.
Read full news article Announcements
Compliances-Certificate under Reg. 74 (5) of SEBI (DP) Regulations 2018
08-Jul-2026 | Source : BSECompliance Certificate under Reg 74(5) of Sebi(DP) Regulation 2018
Closure of Trading Window
26-Jun-2026 | Source : BSEIntimation for closure of trading window
Announcement under Regulation 30 (LODR)-Newspaper Publication
02-Jun-2026 | Source : BSEAs per Attachment
Corporate Actions

No Upcoming Board Meetings

Aarey Drugs & Pharmaceuticals Ltd has declared 1% dividend, ex-date: 13 Dec 18

No Splits history available

Aarey Drugs & Pharmaceuticals Ltd has announced 1:5 bonus issue, ex-date: 25 Jun 12

Aarey Drugs & Pharmaceuticals Ltd has announced 2:1 rights issue, ex-date: 19 Jan 12
Quality key factors
Valuation key factors
Technicals key factors
 Technical Indicator Scale: Bearish, Mildly Bearish, Sideways, Mildly Bullish, Bullish Turned
 Shareholding Snapshot : Mar 2026
Shareholding Compare (%holding)
Non Institution
None
Held by 0 Schemes
Held by 3 FIIs (4.18%)
Bina Rajesh Ghatalia (14.12%)
Elysian Wealth Fund (3.12%)
43.71%
Quarterly Results Snapshot (Standalone) - Mar'26 - YoY

YoY Growth in quarter ended Mar 2026 is 75.27% vs -48.61% in Mar 2025
YoY Growth in quarter ended Mar 2026 is 231.91% vs -78.14% in Mar 2025
Half Yearly Results Snapshot (Standalone) - Sep'25

Growth in half year ended Sep 2025 is -19.69% vs 113.31% in Sep 2024
Growth in half year ended Sep 2025 is -15.49% vs 88.08% in Sep 2024
Nine Monthly Results Snapshot (Standalone) - Dec'25
YoY Growth in nine months ended Dec 2025 is -22.70% vs 97.47% in Dec 2024
YoY Growth in nine months ended Dec 2025 is -16.57% vs 40.71% in Dec 2024
Annual Results Snapshot (Standalone) - Mar'26
YoY Growth in year ended Mar 2026 is -0.35% vs 19.80% in Mar 2025
YoY Growth in year ended Mar 2026 is -1.24% vs -14.10% in Mar 2025
About Aarey Drugs & Pharmaceuticals Ltd

Company Coordinates


