
Compare Aartech Solonics with Similar Stocks
Dashboard
With ROE of 13, it has a Expensive valuation with a 4.3 Price to Book Value
- The stock is trading at a discount compared to its peers' average historical valuations
- Over the past year, while the stock has generated a return of -32.69%, its profits have risen by 67.7% ; the PEG ratio of the company is 0.5
Below par performance in long term as well as near term
Stock DNA
Heavy Electrical Equipment
INR 149 Cr (Micro Cap)
33.00
61
0.20%
-0.19
13.00%
4.42
Total Returns (Price + Dividend) 
Latest dividend: 0.1 per share ex-dividend date: Sep-23-2025
Risk Adjusted Returns v/s
Returns Beta

News

Aartech Solonics Ltd is Rated Sell
Aartech Solonics Ltd is rated 'Sell' by MarketsMOJO, with this rating last updated on 17 Nov 2025. However, the analysis and financial metrics discussed here reflect the stock's current position as of 08 July 2026, providing investors with an up-to-date view of the company’s fundamentals, valuation, financial trend, and technical outlook.
Read full news article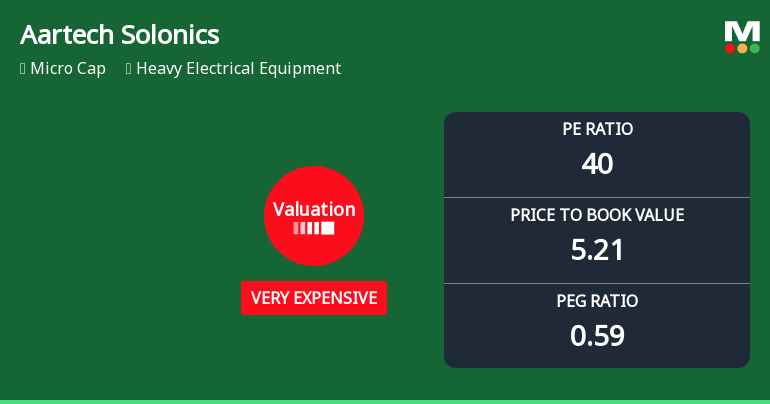
Aartech Solonics Ltd Valuation Shifts Highlight Price Attractiveness Concerns
Aartech Solonics Ltd, a micro-cap player in the Heavy Electrical Equipment sector, has witnessed a significant shift in its valuation parameters, moving from an expensive to a very expensive rating. This change comes alongside a robust price rally, with the stock surging 20% in a single day and outperforming the broader Sensex across multiple time frames. We analyse the implications of these valuation changes, comparing key metrics against historical averages and peer companies to assess the stock’s price attractiveness and investment potential.
Read full news article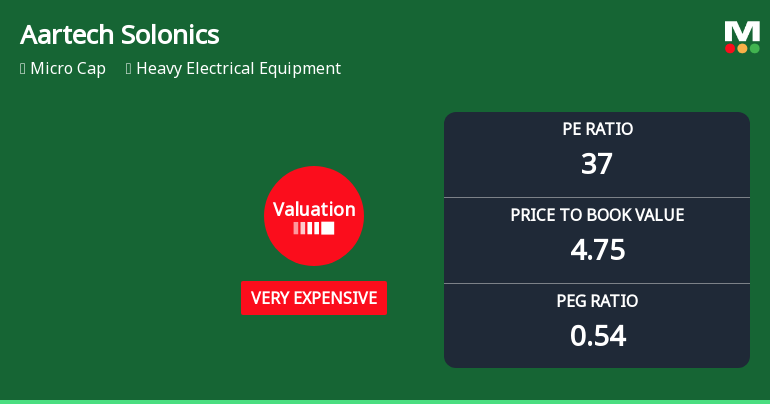
Aartech Solonics Ltd Valuation Shifts Amidst Market Volatility
Aartech Solonics Ltd, a micro-cap player in the Heavy Electrical Equipment sector, has seen a notable shift in its valuation parameters, moving from an expensive to a very expensive rating. This change, coupled with a recent upgrade in its Mojo Grade from Strong Sell to Sell, invites a closer examination of its price-to-earnings (P/E) and price-to-book value (P/BV) ratios relative to historical averages and peer benchmarks.
Read full news article Announcements
Compliances-Certificate under Reg. 74 (5) of SEBI (DP) Regulations 2018
14-Jul-2026 | Source : BSECertificate under Regulation 74(5) of the SEBI (Depositories and Participants) Regulations 2018 for the quarter ended June 30 2026
Closure of Trading Window
29-Jun-2026 | Source : BSEClosure of Trading Window for the quarter and three months ended 30th June 2026
Announcement under Regulation 30 (LODR)-Earnings Call Transcript
01-Jun-2026 | Source : BSEPursuant to Regulation 30 read with Schedule III of the SEBI (Listing Obligations and Disclosure Requirements) Regulations 2015 and in continuation of our earlier intimation regarding the Investor/ Analyst Meeting held on Thursday 28th May 2026 please find enclosed herewith the transcript of said Investor/Analyst meeting conducted with investors/analysts to discuss the financial performance of the Company for the quarter and financial year ended March 31 2026.
Corporate Actions

No Upcoming Board Meetings

Aartech Solonics Ltd has declared 2% dividend, ex-date: 23 Sep 25

Aartech Solonics Ltd has announced 5:10 stock split, ex-date: 09 Aug 24

Aartech Solonics Ltd has announced 1:2 bonus issue, ex-date: 09 Aug 24

No Rights history available
Quality key factors
Valuation key factors
Technicals key factors
 Technical Indicator Scale: Bearish, Mildly Bearish, Sideways, Mildly Bullish, Bullish Turned
 Shareholding Snapshot : Jun 2026
Shareholding Compare (%holding)
Promoters
None
Held by 0 Schemes
Held by 1 FIIs (0.01%)
Anil Anant Raje (22.08%)
Kailash Kabra (5.1%)
39.41%
Quarterly Results Snapshot (Consolidated) - Mar'26 - QoQ

QoQ Growth in quarter ended Mar 2026 is 136.59% vs -36.92% in Dec 2025
QoQ Growth in quarter ended Mar 2026 is 13.33% vs -72.22% in Dec 2025
Half Yearly Results Snapshot (Consolidated) - Sep'25

Growth in half year ended Sep 2025 is 0.12% vs 3.89% in Sep 2024
Growth in half year ended Sep 2025 is 7.81% vs 178.26% in Sep 2024
Nine Monthly Results Snapshot (Consolidated) - Dec'25
YoY Growth in nine months ended Dec 2025 is -9.22% vs 13.36% in Dec 2024
YoY Growth in nine months ended Dec 2025 is -23.64% vs 189.47% in Dec 2024
Annual Results Snapshot (Consolidated) - Mar'26
YoY Growth in year ended Mar 2026 is 12.46% vs 11.03% in Mar 2025
YoY Growth in year ended Mar 2026 is 48.35% vs 110.00% in Mar 2025
About Aartech Solonics Ltd

Company Coordinates


