
Compare Aartech Solonics with Similar Stocks
Dashboard
With ROE of 13, it has a Expensive valuation with a 4.6 Price to Book Value
- The stock is trading at a discount compared to its peers' average historical valuations
- Over the past year, while the stock has generated a return of -26.80%, its profits have risen by 67.7% ; the PEG ratio of the company is 0.5
Underperformed the market in the last 1 year
Stock DNA
Heavy Electrical Equipment
INR 162 Cr (Micro Cap)
35.00
60
0.20%
-0.19
13.00%
4.60
Total Returns (Price + Dividend) 
Latest dividend: 0.1 per share ex-dividend date: Sep-23-2025
Risk Adjusted Returns v/s
Returns Beta

News
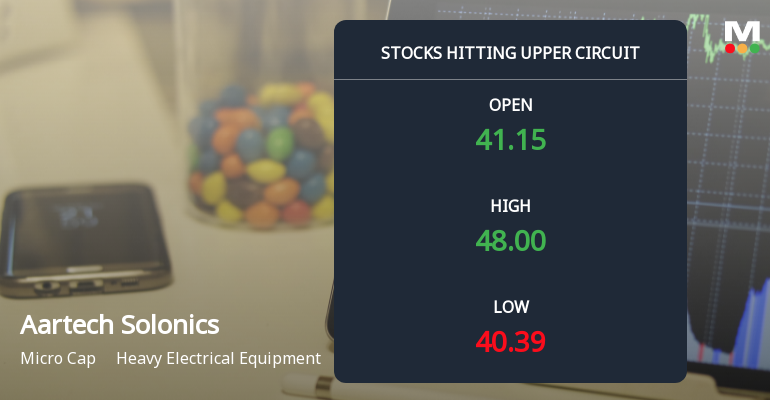
Aartech Solonics Ltd Locks at Upper Circuit With 14.7% Gain — Buyers Queue, Sellers Absent
At Rs 49.38, the buying was done — not because demand dried up, but because the exchange wouldn't let the stock go any higher. Aartech Solonics Ltd locked at its upper circuit of 14.7% on 15 Jun 2026, with buyers queuing and no sellers willing to part with shares.
Read full news article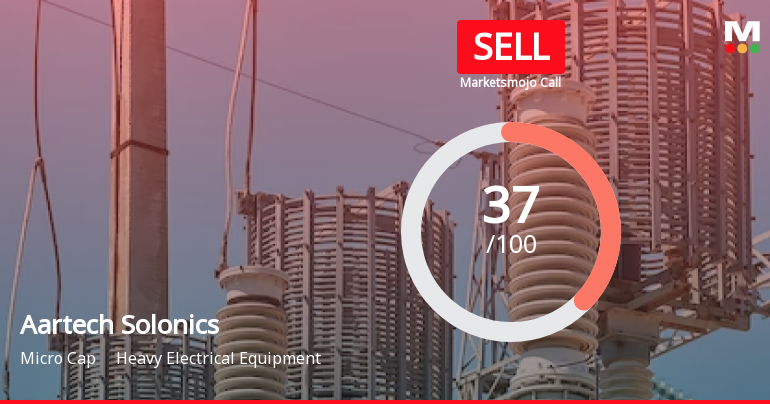
Aartech Solonics Ltd is Rated Sell
Aartech Solonics Ltd is rated 'Sell' by MarketsMOJO, with this rating last updated on 17 Nov 2025. However, the analysis and financial metrics discussed here reflect the stock’s current position as of 16 June 2026, providing investors with an up-to-date view of the company’s fundamentals, valuation, financial trends, and technical outlook.
Read full news article
Aartech Solonics Ltd is Rated Sell
Aartech Solonics Ltd is rated 'Sell' by MarketsMOJO, with this rating last updated on 17 Nov 2025. However, the analysis and financial metrics presented here reflect the stock's current position as of 01 June 2026, providing investors with an up-to-date view of its fundamentals, returns, and market standing.
Read full news article Announcements
Announcement under Regulation 30 (LODR)-Earnings Call Transcript
01-Jun-2026 | Source : BSEPursuant to Regulation 30 read with Schedule III of the SEBI (Listing Obligations and Disclosure Requirements) Regulations 2015 and in continuation of our earlier intimation regarding the Investor/ Analyst Meeting held on Thursday 28th May 2026 please find enclosed herewith the transcript of said Investor/Analyst meeting conducted with investors/analysts to discuss the financial performance of the Company for the quarter and financial year ended March 31 2026.
Announcement under Regulation 30 (LODR)-Investor Presentation
28-May-2026 | Source : BSEPursuant to Regulation 46(2) of the SEBI (Listing Obligations and Disclosure Requirements) Regulations 2015 as amended from time to time please find enclosed herewith a copy of the Investor Presentation for the quarter and year ended March 31 2026. Further inform you that the said information will be available on the website of the Company: www.aartechsolonics.com
Announcement under Regulation 30 (LODR)-Newspaper Publication
28-May-2026 | Source : BSESubmission of Newspaper Advertisement - Audited Standalone and Consolidated Financial Results of the Company for the Fourth Quarter and Year ended 31st March 2026
Corporate Actions

No Upcoming Board Meetings

Aartech Solonics Ltd has declared 2% dividend, ex-date: 23 Sep 25

Aartech Solonics Ltd has announced 5:10 stock split, ex-date: 09 Aug 24

Aartech Solonics Ltd has announced 1:2 bonus issue, ex-date: 09 Aug 24

No Rights history available
Quality key factors
Valuation key factors
Technicals key factors
 Technical Indicator Scale: Bearish, Mildly Bearish, Sideways, Mildly Bullish, Bullish Turned
 Shareholding Snapshot : Mar 2026
Shareholding Compare (%holding)
Promoters
None
Held by 0 Schemes
Held by 0 FIIs
Anil Anant Raje (22.08%)
Kailash Kabra (5.1%)
38.18%
Quarterly Results Snapshot (Consolidated) - Mar'26 - QoQ

QoQ Growth in quarter ended Mar 2026 is 136.59% vs -36.92% in Dec 2025
QoQ Growth in quarter ended Mar 2026 is 13.33% vs -72.22% in Dec 2025
Half Yearly Results Snapshot (Consolidated) - Sep'25

Growth in half year ended Sep 2025 is 0.12% vs 3.89% in Sep 2024
Growth in half year ended Sep 2025 is 7.81% vs 178.26% in Sep 2024
Nine Monthly Results Snapshot (Consolidated) - Dec'25
YoY Growth in nine months ended Dec 2025 is -9.22% vs 13.36% in Dec 2024
YoY Growth in nine months ended Dec 2025 is -23.64% vs 189.47% in Dec 2024
Annual Results Snapshot (Consolidated) - Mar'26
YoY Growth in year ended Mar 2026 is 12.46% vs 11.03% in Mar 2025
YoY Growth in year ended Mar 2026 is 48.35% vs 110.00% in Mar 2025
About Aartech Solonics Ltd

Company Coordinates


