
Compare AB Cotspin with Similar Stocks
Dashboard
Weak Long Term Fundamental Strength with an average Return on Capital Employed (ROCE) of 8.14%
- Low ability to service debt as the company has a high Debt to EBITDA ratio of 3.68 times
Flat results in Mar 26
With ROCE of 8.6, it has a Expensive valuation with a 2 Enterprise value to Capital Employed
Underperformed the market in the last 1 year
Stock DNA
Garments & Apparels
INR 448 Cr (Micro Cap)
34.00
25
0.00%
0.95
8.50%
2.85
Total Returns (Price + Dividend) 
AB Cotspin for the last several years.
Risk Adjusted Returns v/s
Returns Beta

News
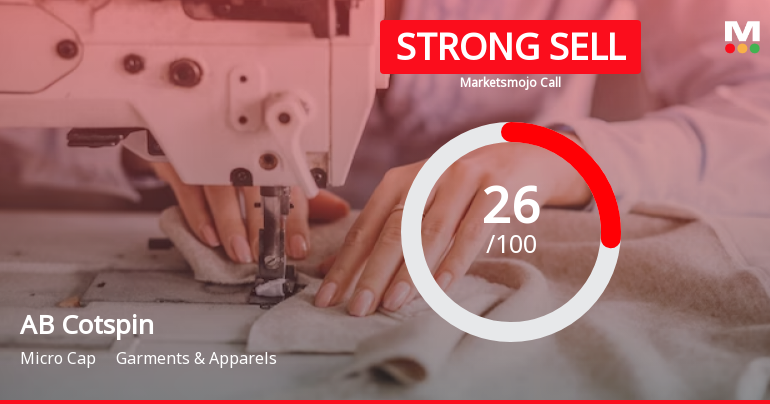
AB Cotspin India Ltd is Rated Strong Sell
AB Cotspin India Ltd is rated Strong Sell by MarketsMOJO. This rating was last updated on 29 May 2026. However, the analysis and financial metrics discussed here reflect the stock’s current position as of 26 July 2026, providing investors with the most recent and relevant data to assess the company’s outlook.
Read full news article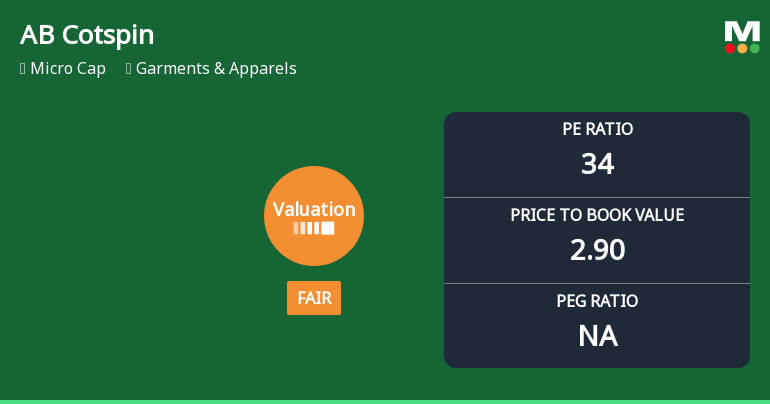
AB Cotspin India Ltd Valuation Shifts to Fair Amidst Market Challenges
AB Cotspin India Ltd, a micro-cap player in the Garments & Apparels sector, has witnessed a notable shift in its valuation parameters, moving from an expensive to a fair valuation grade. Despite persistent headwinds in the industry and a challenging price performance relative to the Sensex, the company’s price-to-earnings (P/E) and price-to-book value (P/BV) ratios suggest improved price attractiveness compared to its historical and peer averages.
Read full news article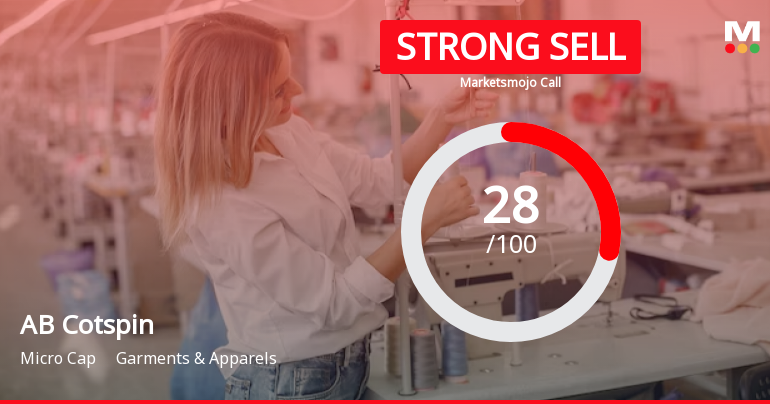
AB Cotspin India Ltd is Rated Strong Sell
AB Cotspin India Ltd is rated Strong Sell by MarketsMOJO. This rating was last updated on 29 May 2026, reflecting a reassessment of the stock’s outlook. However, all fundamentals, returns, and financial metrics discussed below are based on the company’s current position as of 15 July 2026, providing investors with the latest insights into its performance and prospects.
Read full news article Announcements
Corporate Actions

No Upcoming Board Meetings

No Dividend history available

No Splits history available

No Bonus history available

No Rights history available
Quality key factors
Valuation key factors
Technicals key factors
 Technical Indicator Scale: Bearish, Mildly Bearish, Sideways, Mildly Bullish, Bullish Turned
 Shareholding Snapshot : Jun 2026
Shareholding Compare (%holding)
Promoters
None
Held by 0 Schemes
Held by 2 FIIs (0.11%)
Deepak Garg (23.25%)
Lotus Global Enterprises Limited (6.5%)
30.38%
Quarterly Results Snapshot (Consolidated) - Mar'26 - QoQ

QoQ Growth in quarter ended Mar 2026 is 34.95% vs 52.21% in Dec 2025
QoQ Growth in quarter ended Mar 2026 is -40.06% vs -9.67% in Dec 2025
Half Yearly Results Snapshot (Consolidated) - Sep'25
Growth in half year ended Sep 2025 is -23.68% vs 38.60% in Sep 2024
Growth in half year ended Sep 2025 is 93.55% vs 103.54% in Sep 2024
Nine Monthly Results Snapshot (Consolidated) - Dec'25
YoY Growth in nine months ended Dec 2025 is -8.66% vs -0.99% in Dec 2024
YoY Growth in nine months ended Dec 2025 is 36.67% vs 105.58% in Dec 2024
Annual Results Snapshot (Consolidated) - Mar'26
YoY Growth in year ended Mar 2026 is 0.23% vs 16.58% in Mar 2025
YoY Growth in year ended Mar 2026 is 27.62% vs 52.39% in Mar 2025
About AB Cotspin India Ltd

Company Coordinates


