
Compare Aban Offshore with Similar Stocks
Dashboard
With a Negative Book Value, the company has a Weak Long Term Fundamental Strength
- Poor long term growth as Net Sales has grown by an annual rate of -18.14% and Operating profit at 0% over the last 5 years
- The company has a negative book value of Rs 26,875.86 crore
Flat results in Dec 25
Risky - Negative Book Value
Total Returns (Price + Dividend) 

Risk Adjusted Returns v/s
Returns Beta
News
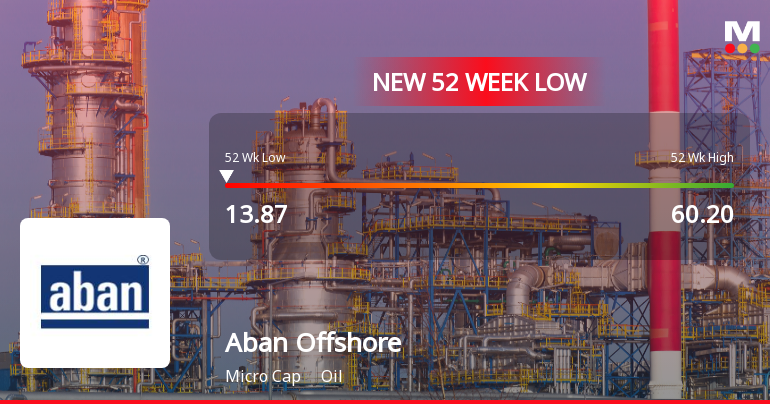
Markets Rally, But Aban Offshore Ltd Sinks to 52-Week Low in Stock-Specific Sell-Off
While the broader market indices have been on a steady ascent, Aban Offshore Ltd has diverged sharply, hitting a fresh 52-week low of Rs 13.87 on 22 Jun 2026. This decline marks a staggering 75.91% drop over the past year, underscoring persistent headwinds for the oil sector micro-cap.
Read full news article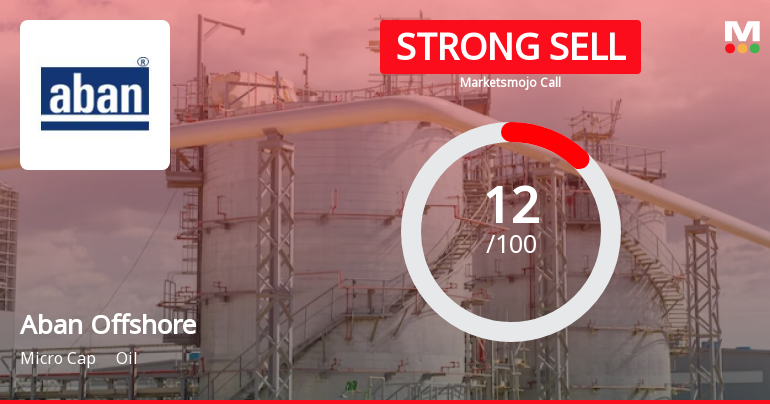
Aban Offshore Ltd is Rated Strong Sell
Aban Offshore Ltd is rated Strong Sell by MarketsMOJO, with this rating last updated on 05 Aug 2025. However, the analysis and financial metrics discussed here reflect the company’s current position as of 17 June 2026, providing investors with an up-to-date view of the stock’s fundamentals, valuation, financial trends, and technical outlook.
Read full news article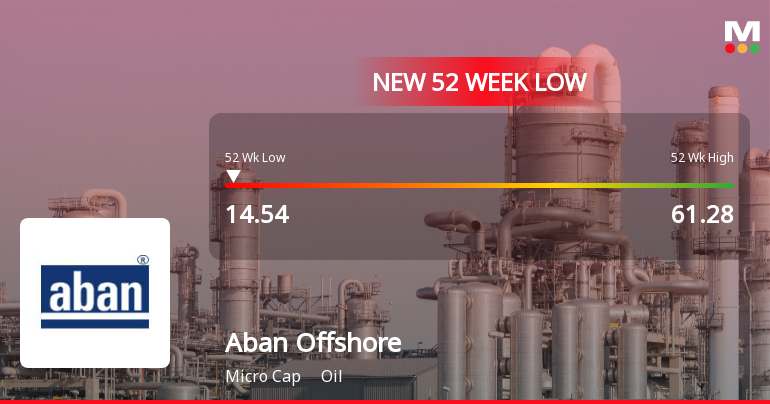
Markets Rally, But Aban Offshore Ltd Sinks to 52-Week Low in Stock-Specific Sell-Off
While the Sensex surged by 1.49% today, Aban Offshore Ltd plunged to a fresh 52-week low of Rs 14.54, extending its steep decline over the past year to a staggering 73.42%. This stark divergence highlights the persistent challenges facing the company amid a broadly buoyant market.
Read full news article Announcements
Aban Offshore Limited - Reply to Clarification- Financial results
22-Nov-2019 | Source : NSEAban Offshore Limitedshore Limited for the quarter ended 30-Sep-2019 with respect to Regulation 33 of the SEBI (Listing Obligations and Disclosure Requirements) Regulations, 2015.
Aban Offshore Limited - Updates
18-Nov-2019 | Source : NSEAban Offshore Limited has informed the Exchange regarding 'UPDATES'.
Aban Offshore Limited - Clarification - Financial Results
14-Nov-2019 | Source : NSEAban Offshore Limitedmited for the quarter ended 30-Sep-2019 with respect to Regulation 33 of the SEBI (Listing Obligations and Disclosure Requirements) Regulations, 2015.
Corporate Actions

No Upcoming Board Meetings

Aban Offshore Ltd has declared 180% dividend, ex-date: 14 Sep 15

No Splits history available

No Bonus history available

No Rights history available
Quality key factors
Valuation key factors
Technicals key factors
 Technical Indicator Scale: Bearish, Mildly Bearish, Sideways, Mildly Bullish, Bullish Turned
 Shareholding Snapshot : Mar 2026
Shareholding Compare (%holding)
Non Institution
19.3696
Held by 1 Schemes (0.0%)
Held by 1 FIIs (0.0%)
India Offshore Inc (14.27%)
None
47.93%
Quarterly Results Snapshot (Consolidated) - Dec'25 - QoQ

QoQ Growth in quarter ended Dec 2025 is -12.85% vs -8.43% in Sep 2025

QoQ Growth in quarter ended Dec 2025 is 109.61% vs -21.61% in Sep 2025
Half Yearly Results Snapshot (Consolidated) - Sep'25
Growth in half year ended Sep 2025 is -10.03% vs 45.10% in Sep 2024
Growth in half year ended Sep 2025 is -58.72% vs 45.78% in Sep 2024
Nine Monthly Results Snapshot (Consolidated) - Dec'25
YoY Growth in nine months ended Dec 2025 is -13.74% vs 37.28% in Dec 2024
YoY Growth in nine months ended Dec 2025 is 15.70% vs 35.61% in Dec 2024
Annual Results Snapshot (Consolidated) - Mar'25
YoY Growth in year ended Mar 2025 is 19.01% vs 0.74% in Mar 2024
YoY Growth in year ended Mar 2025 is 32.51% vs -20.82% in Mar 2024
About Aban Offshore Ltd

Company Coordinates


