
Compare ABM Knowledge with Similar Stocks
Stock DNA
Software Products
INR 396 Cr (Micro Cap)
42.00
20
0.63%
-0.38
3.90%
1.65
Total Returns (Price + Dividend) 
Latest dividend: 1.25 per share ex-dividend date: Aug-22-2025
Risk Adjusted Returns v/s
Returns Beta

News

ABM Knowledgeware Ltd is Rated Strong Sell
ABM Knowledgeware Ltd is rated Strong Sell by MarketsMOJO, with this rating last updated on 29 May 2026. However, the analysis and financial metrics presented here reflect the stock’s current position as of 15 July 2026, providing investors with an up-to-date view of the company’s fundamentals, valuation, financial trends, and technical outlook.
Read full news article
ABM Knowledgeware Ltd is Rated Strong Sell
ABM Knowledgeware Ltd is rated Strong Sell by MarketsMOJO, with this rating last updated on 29 May 2026. However, the analysis and financial metrics discussed here reflect the stock’s current position as of 04 July 2026, providing investors with the latest insights into the company’s performance and outlook.
Read full news article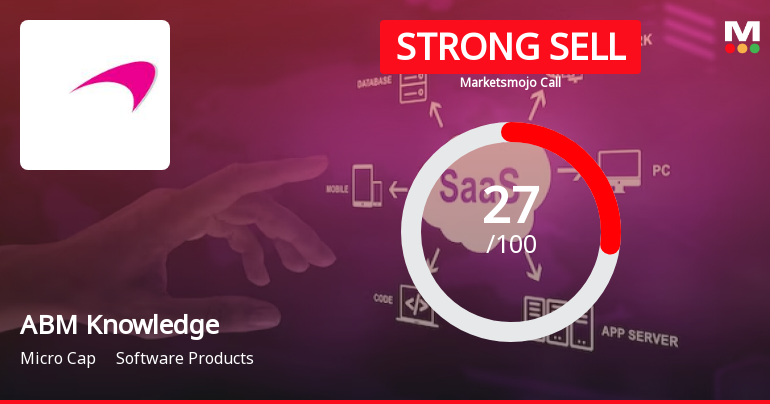
ABM Knowledgeware Ltd is Rated Strong Sell
ABM Knowledgeware Ltd is rated Strong Sell by MarketsMOJO. This rating was last updated on 29 May 2026. However, the analysis and financial metrics discussed below reflect the stock’s current position as of 23 June 2026, providing investors with an up-to-date view of the company’s fundamentals, valuation, financial trends, and technical outlook.
Read full news article Announcements
Intimation For Completion Of Dispatch Of AGM Notice And Annual Reports Through Email To The Shareholders
04-Jul-2026 | Source : BSEIntimation for completion of Dispatch of AGM Notice and Annual Report for the F.Y 2025-2026 through Email to the Shareholders of the Company.
Announcement under Regulation 30 (LODR)-Newspaper Publication
04-Jul-2026 | Source : BSESubmission of Notice of 33rd Annual General Meeting of the company.
Record Date For The Purpose Of Final Dividend For The Financial Year 2025-26.
03-Jul-2026 | Source : BSEIntimation of the Record for the Purpose of Final Dividend for the F.Y. 2025-2026.
Corporate Actions

No Upcoming Board Meetings

ABM Knowledgeware Ltd has declared 25% dividend, ex-date: 23 Jul 26

ABM Knowledgeware Ltd has announced 5:10 stock split, ex-date: 07 Apr 16

No Bonus history available

No Rights history available
Quality key factors
Valuation key factors
Technicals key factors
 Technical Indicator Scale: Bearish, Mildly Bearish, Sideways, Mildly Bullish, Bullish Turned
 Shareholding Snapshot : Mar 2026
Shareholding Compare (%holding)
Promoters
None
Held by 0 Schemes
Held by 0 FIIs
Prakash Baburao Rane (47.71%)
New Computer Era Ltd (5%)
17.95%
Quarterly Results Snapshot (Consolidated) - Mar'26 - QoQ

QoQ Growth in quarter ended Mar 2026 is -16.95% vs 39.22% in Dec 2025
QoQ Growth in quarter ended Mar 2026 is -7.81% vs -4.95% in Dec 2025
Half Yearly Results Snapshot (Consolidated) - Sep'25

Growth in half year ended Sep 2025 is 7.15% vs 0.71% in Sep 2024
Growth in half year ended Sep 2025 is -19.67% vs 8.31% in Sep 2024
Nine Monthly Results Snapshot (Consolidated) - Dec'25
YoY Growth in nine months ended Dec 2025 is 7.82% vs 11.89% in Dec 2024
YoY Growth in nine months ended Dec 2025 is -28.09% vs 16.72% in Dec 2024
Annual Results Snapshot (Consolidated) - Mar'26
YoY Growth in year ended Mar 2026 is 7.02% vs 6.06% in Mar 2025
YoY Growth in year ended Mar 2026 is -34.33% vs -0.62% in Mar 2025
About ABM Knowledgeware Ltd

Company Coordinates


