
Compare Adani Energy Sol with Similar Stocks
Dashboard
Poor Management Efficiency with a low ROCE of 9.07%
- The company has been able to generate a Return on Capital Employed (avg) of 9.07% signifying low profitability per unit of total capital (equity and debt)
High Debt Company with a Debt to Equity ratio (avg) of 2.30 times
Healthy long term growth as Net Sales has grown by an annual rate of 22.68% and Operating profit at 22.07%
Flat results in Mar 26
With ROCE of 10.4, it has a Very Expensive valuation with a 3.5 Enterprise value to Capital Employed
Total Returns (Price + Dividend) 
Adani Energy Sol for the last several years.
Risk Adjusted Returns v/s
Returns Beta

News
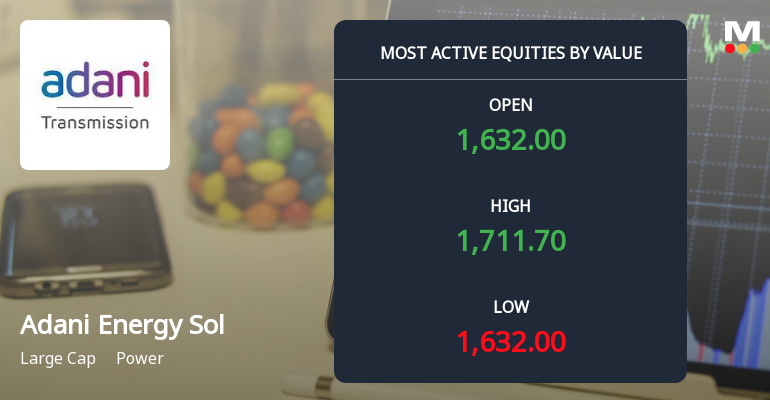
Adani Energy Solutions Ltd Sees Robust Trading Activity Amidst Strong Market Momentum
Adani Energy Solutions Ltd (ADANIENSOL) has emerged as one of the most actively traded stocks by value on 8 July 2026, reflecting strong investor interest and robust market momentum. The large-cap power sector company recorded a total traded volume of 23.79 lakh shares with a turnover exceeding ₹400 crore, marking a significant surge in liquidity and institutional participation. The stock’s recent performance, including a fresh 52-week high and a notable upgrade in its mojo grade, underscores its growing appeal amid a volatile market backdrop.
Read full news article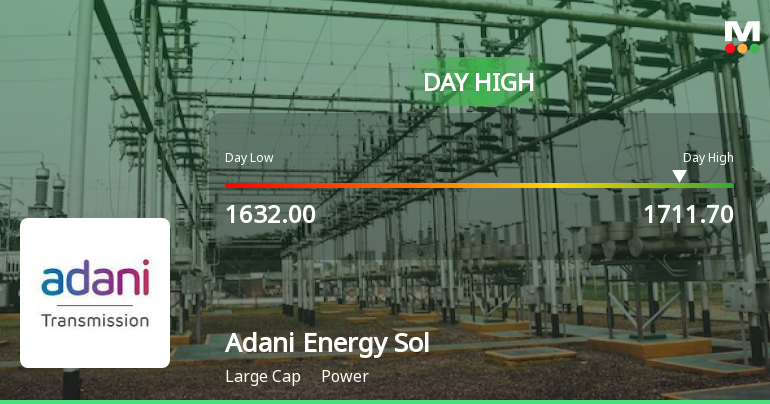
Adani Energy Solutions Ltd Surges 3.46% to Day's High of Rs 1710 — Outperforms Sector by 2.79 Percentage Points
The Sensex declined 0.64% on 8 Jul 2026, yet Adani Energy Solutions Ltd rose 3.46%, touching a day high of Rs 1710 and outperforming its sector by 2.79 percentage points. This strong single-session gain marks the seventh consecutive day of advances, rewriting the short-term narrative for this power sector heavyweight.
Read full news article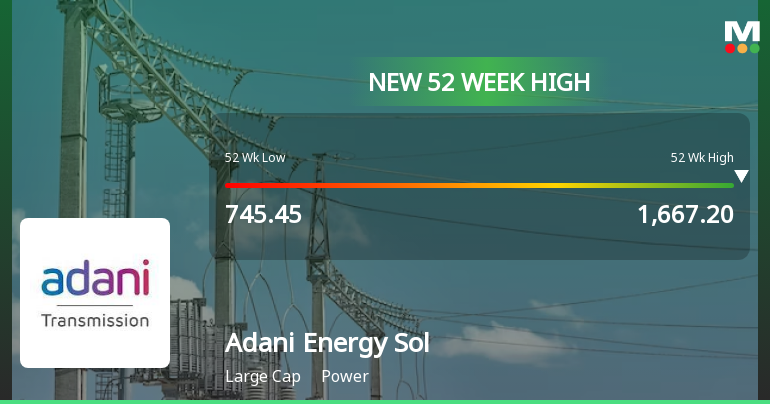
Broad-Based Technical Strength Lifts Adani Energy Solutions Ltd to 52-Week High of Rs 1667.2
With a sustained seven-day rally delivering an 11.77% gain, Adani Energy Solutions Ltd surged to a fresh 52-week high of Rs 1667.2 on 8 Jul 2026, outpacing its sector by 0.76% amid a broadly cautious market backdrop.
Read full news article Announcements
Announcement under Regulation 30 (LODR)-Newspaper Publication
03-Jul-2026 | Source : BSENewspaper Advertisement-Notice of Extra-Ordinary General meeting through Video Conferencing / Other Audio Visual Means (VC/ OAVM) facility and Remote E-voting Information
Notice Of Extra Ordinary General Meeting
02-Jul-2026 | Source : BSENotice of Extra Ordinary General Meeting of the Company
Board Meeting Outcome for Outcome Of Board Meeting
01-Jul-2026 | Source : BSEOutcome of Board Meeting
Corporate Actions

21 Jul 2026

No Dividend history available

No Splits history available

No Bonus history available

No Rights history available
Quality key factors
Valuation key factors
Technicals key factors
 Technical Indicator Scale: Bearish, Mildly Bearish, Sideways, Mildly Bullish, Bullish Turned
 Shareholding Snapshot : Mar 2026
Shareholding Compare (%holding)
Promoters
0.538
Held by 33 Schemes (6.59%)
Held by 191 FIIs (12.23%)
Gautambhai Shantilal Adani And Rajeshbhai Shantilal Adani (on Behalf Of S.b. Adani Family Trust) (50.08%)
Sbi Equity Hybrid Fund (3.67%)
2.72%
Quarterly Results Snapshot (Consolidated) - Mar'26 - YoY

YoY Growth in quarter ended Mar 2026 is 16.76% vs 35.43% in Mar 2025
YoY Growth in quarter ended Mar 2026 is 5.66% vs 79.05% in Mar 2025
Half Yearly Results Snapshot (Consolidated) - Sep'25
Growth in half year ended Sep 2025 is 16.03% vs 57.57% in Sep 2024

Growth in half year ended Sep 2025 is 802.50% vs -133.03% in Sep 2024
Nine Monthly Results Snapshot (Consolidated) - Dec'25
YoY Growth in nine months ended Dec 2025 is 15.82% vs 46.15% in Dec 2024
YoY Growth in nine months ended Dec 2025 is 287.28% vs -46.79% in Dec 2024
Annual Results Snapshot (Consolidated) - Mar'26
YoY Growth in year ended Mar 2026 is 16.08% vs 43.11% in Mar 2025
YoY Growth in year ended Mar 2026 is 115.34% vs -6.80% in Mar 2025
About Adani Energy Solutions Ltd

Company Coordinates


