
Compare Adani Green with Similar Stocks
Dashboard
High Debt company with Weak Long Term Fundamental Strength
- High Debt Company with a Debt to Equity ratio (avg) of 8.63 times
- The company has been able to generate a Return on Capital Employed (avg) of 6.61% signifying low profitability per unit of total capital (equity and debt)
Negative results in Mar 26
With ROCE of 6.2, it has a Very Expensive valuation with a 3 Enterprise value to Capital Employed
Total Returns (Price + Dividend) 
Adani Green for the last several years.
Risk Adjusted Returns v/s
Returns Beta

News
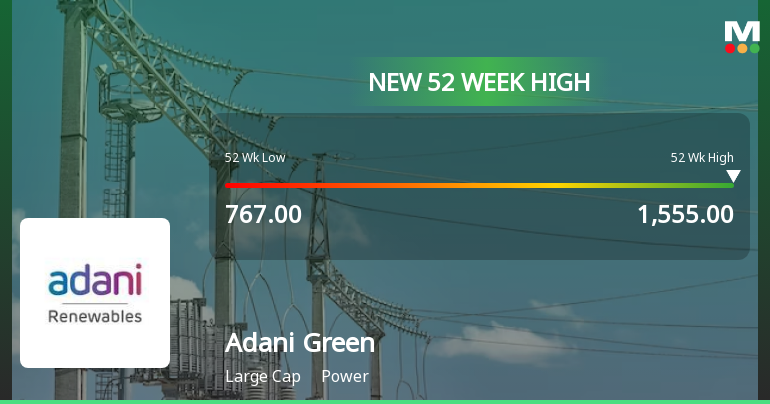
Broad-Based Technical Strength Lifts Adani Green Energy Ltd to 52-Week High of Rs 1555
Surging past its previous peak, Adani Green Energy Ltd touched a fresh 52-week high of Rs 1555 on 22 Jun 2026, marking a remarkable 63.65% gain over the past year against the Sensex’s decline of 6.45%. This milestone underscores the stock’s robust price momentum and technical alignment amid a cautiously optimistic market backdrop.
Read full news article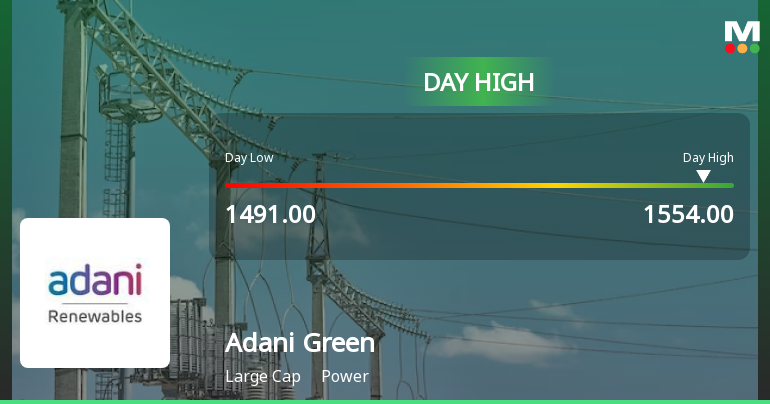
Adani Green Energy Ltd Surges 3.36% to Day's High of Rs 1552 — Outperforms Sector by 2.67 Percentage Points
The Sensex edged higher by 0.42% on 22 Jun 2026, yet Adani Green Energy Ltd outpaced the broader market with a 3.36% gain, touching an intraday high of Rs 1552. This 2.67 percentage-point outperformance over the Power sector highlights a distinctly stock-specific momentum shift rather than a general market uplift.
Read full news article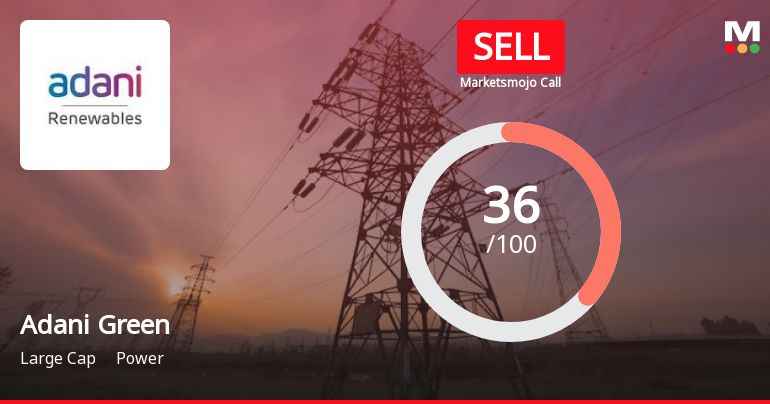
Adani Green Energy Ltd is Rated Sell
Adani Green Energy Ltd is rated 'Sell' by MarketsMOJO, with this rating last updated on 06 May 2026. However, the analysis and financial metrics discussed here reflect the stock's current position as of 20 June 2026, providing investors with an up-to-date view of the company’s fundamentals, valuation, financial trends, and technical outlook.
Read full news article Announcements
Incorporation Of Wholly Owned Subsidiary
12-Jun-2026 | Source : BSEIncorporation of wholly owned subsidiary
Intimation Of ESG Rating
12-Jun-2026 | Source : BSEIntimation of ESG rating
Announcement under Regulation 30 (LODR)-Newspaper Publication
02-Jun-2026 | Source : BSENewspaper Advertisement - Notice of 11th Annual General Meeting Intimation of cut-off date and E-voting information
Corporate Actions

No Upcoming Board Meetings

No Dividend history available

No Splits history available

No Bonus history available

No Rights history available
Quality key factors
Valuation key factors
Technicals key factors
 Technical Indicator Scale: Bearish, Mildly Bearish, Sideways, Mildly Bullish, Bullish Turned
 Shareholding Snapshot : Mar 2026
Shareholding Compare (%holding)
Promoters
None
Held by 31 Schemes (3.22%)
Held by 181 FIIs (11.1%)
Adani Trading Services Llp (28.8%)
Totalenergies Renewables Indian Ocean Ltd (13.84%)
3.8%
Quarterly Results Snapshot (Consolidated) - Mar'26 - QoQ

QoQ Growth in quarter ended Mar 2026 is 33.77% vs -12.97% in Dec 2025
QoQ Growth in quarter ended Mar 2026 is 1,068.29% vs -107.03% in Dec 2025
Half Yearly Results Snapshot (Consolidated) - Sep'25

Growth in half year ended Sep 2025 is 17.40% vs 32.34% in Sep 2024
Growth in half year ended Sep 2025 is 79.50% vs 4.03% in Sep 2024
Nine Monthly Results Snapshot (Consolidated) - Dec'25
YoY Growth in nine months ended Dec 2025 is 15.81% vs 21.60% in Dec 2024
YoY Growth in nine months ended Dec 2025 is 3.38% vs 27.79% in Dec 2024
Annual Results Snapshot (Consolidated) - Mar'26
YoY Growth in year ended Mar 2026 is 15.31% vs 21.61% in Mar 2025
YoY Growth in year ended Mar 2026 is 14.40% vs 31.27% in Mar 2025
About Adani Green Energy Ltd

Company Coordinates


