
Compare Adarsh Plant with Similar Stocks
Dashboard
High Debt company with Weak Long Term Fundamental Strength
- Poor long term growth as Net Sales has grown by an annual rate of -0.94% and Operating profit at -2.30% over the last 5 years
- High Debt Company with a Debt to Equity ratio (avg) of 4.89 times
- The company has been able to generate a Return on Capital Employed (avg) of 5.68% signifying low profitability per unit of total capital (equity and debt)
Flat results in Mar 26
With ROCE of -20.7, it has a Very Expensive valuation with a 7.4 Enterprise value to Capital Employed
Stock DNA
Pesticides & Agrochemicals
INR 28 Cr (Micro Cap)
NA (Loss Making)
32
0.00%
4.15
-2.00%
29.24
Total Returns (Price + Dividend) 
Adarsh Plant for the last several years.
Risk Adjusted Returns v/s
Returns Beta

News

Adarsh Plant Protect Ltd Upgraded to Sell on Technical Improvements Despite Valuation Concerns
Adarsh Plant Protect Ltd, a micro-cap player in the pesticides and agrochemicals sector, has seen its investment rating upgraded from Strong Sell to Sell as of 22 June 2026. This change reflects nuanced shifts across technical indicators, valuation metrics, financial trends, and overall quality assessments, signalling a cautious but slightly more optimistic outlook for investors.
Read full news article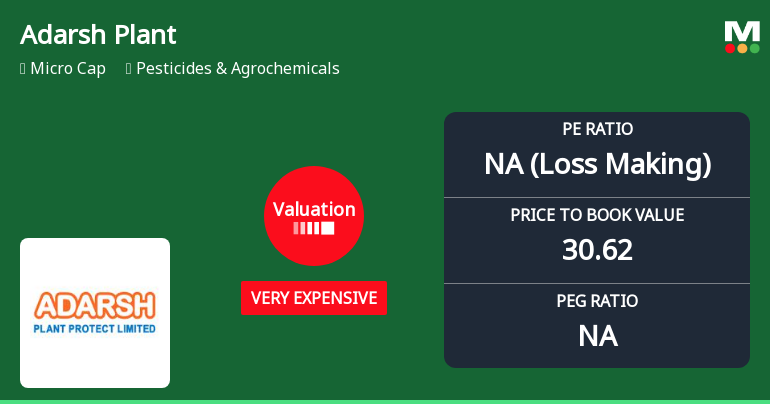
Adarsh Plant Protect Ltd Valuation Shifts Signal Heightened Price Risk
Adarsh Plant Protect Ltd, a micro-cap player in the Pesticides & Agrochemicals sector, has seen its valuation parameters shift markedly, moving from expensive to very expensive territory. Despite a strong long-term return profile, recent financial metrics and valuation multiples raise questions about the stock’s price attractiveness relative to its peers and historical averages.
Read full news article
Adarsh Plant Protect Ltd Downgraded to Strong Sell Amid Technical and Fundamental Concerns
Adarsh Plant Protect Ltd, a micro-cap player in the Pesticides & Agrochemicals sector, has seen its investment rating downgraded from Sell to Strong Sell as of 15 June 2026. This revision follows a comprehensive reassessment across four critical parameters: Quality, Valuation, Financial Trend, and Technicals. The downgrade reflects deteriorating technical indicators, flat financial performance, and persistent fundamental weaknesses, signalling caution for investors.
Read full news article Announcements
General-Updates
18-Jun-2026 | Source : BSENewspaper Publication regarding Special Window for transfer requests of physical shares.
General-Updates
02-Jun-2026 | Source : BSENewspaper Publication of the Audited Financial Results of the Company for the quarter and year ended on 31st March 2026.
Board Meeting Outcome for OUTCOME OF THE BOARD MEETING
28-May-2026 | Source : BSEOutcome of the Board Meeting held on 28.05.2026 to consider the approve the Audited Financial Statements for the quarter and year ended on 31st March 2026
Corporate Actions

No Upcoming Board Meetings

No Dividend history available

No Splits history available

No Bonus history available

No Rights history available
Quality key factors
Valuation key factors
Technicals key factors
 Technical Indicator Scale: Bearish, Mildly Bearish, Sideways, Mildly Bullish, Bullish Turned
 Shareholding Snapshot : Mar 2026
Shareholding Compare (%holding)
Promoters
None
Held by 0 Schemes
Held by 0 FIIs
Naishadkumar Naginbhai Patel (40.61%)
Jayshree Sanjay Patni (4.09%)
26.24%
Quarterly Results Snapshot (Standalone) - Mar'26 - QoQ

QoQ Growth in quarter ended Mar 2026 is 24.12% vs -29.20% in Dec 2025
QoQ Growth in quarter ended Mar 2026 is 220.00% vs -600.00% in Dec 2025
Half Yearly Results Snapshot (Standalone) - Sep'25

Growth in half year ended Sep 2025 is -32.03% vs 19.53% in Sep 2024
Growth in half year ended Sep 2025 is -121.43% vs 40.00% in Sep 2024
Nine Monthly Results Snapshot (Standalone) - Dec'25
YoY Growth in nine months ended Dec 2025 is -32.34% vs -0.76% in Dec 2024
YoY Growth in nine months ended Dec 2025 is -153.33% vs -42.31% in Dec 2024
Annual Results Snapshot (Standalone) - Mar'26
YoY Growth in year ended Mar 2026 is -31.20% vs -6.17% in Mar 2025
YoY Growth in year ended Mar 2026 is 98.28% vs -336.73% in Mar 2025
About Adarsh Plant Protect Ltd

Company Coordinates


