
Compare ADC India with Similar Stocks
Dashboard
The company is Net-Debt Free
Healthy long term growth as Net Sales has grown by an annual rate of 27.29% and Operating profit at 36.28%
Flat results in Mar 26
With ROE of 21.8, it has a Very Expensive valuation with a 11.5 Price to Book Value
Despite the size of the company, domestic mutual funds hold only 0% of the company
Market Beating performance in long term as well as near term
Stock DNA
Telecom - Equipment & Accessories
INR 961 Cr (Micro Cap)
53.00
20
0.24%
-0.71
21.82%
11.21
Total Returns (Price + Dividend) 
Latest dividend: 24.69051289721347 per share ex-dividend date: Jul-31-2026
Risk Adjusted Returns v/s
Returns Beta

News
ADC India Communications Ltd is Rated Hold
ADC India Communications Ltd is rated 'Hold' by MarketsMOJO, with this rating last updated on 06 May 2026. While the rating was revised on that date, the analysis and financial metrics discussed here reflect the stock's current position as of 23 July 2026, providing investors with an up-to-date perspective on the company’s performance and outlook.
Read full news article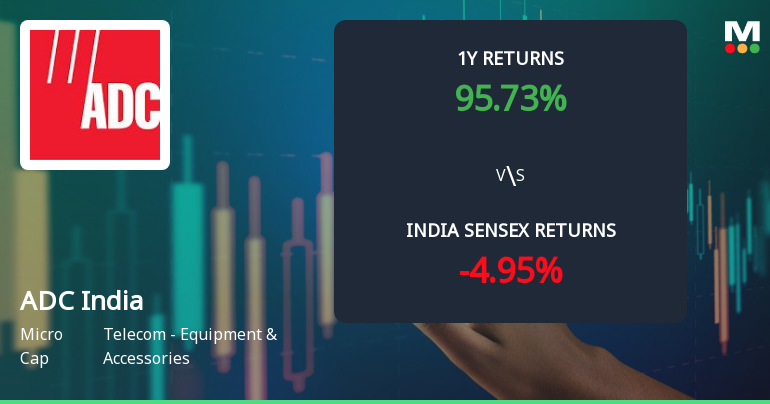
ADC India Communications Ltd Technical Momentum Shifts Amid Mixed Indicator Signals
ADC India Communications Ltd, a micro-cap player in the Telecom - Equipment & Accessories sector, has experienced a notable shift in its technical momentum, reflecting a complex interplay of bullish and bearish signals across key indicators. Despite a recent downgrade in daily price performance, the stock’s year-to-date and longer-term returns continue to outpace the broader market, prompting a nuanced reassessment of its near-term outlook.
Read full news article
ADC India Communications Ltd is Rated Hold
ADC India Communications Ltd is rated 'Hold' by MarketsMOJO. This rating was last updated on 06 May 2026, reflecting a shift from a previous 'Sell' stance. However, the analysis and financial metrics discussed here represent the stock's current position as of 12 July 2026, providing investors with an up-to-date perspective on the company’s performance and outlook.
Read full news article Announcements
Announcement under Regulation 30 (LODR)-Demise
27-Jul-2026 | Source : BSEDemise of Independent Director - Ms. Vijaya Latha Reddy
Announcement under Regulation 30 (LODR)-Change in Directorate
27-Jul-2026 | Source : BSEDemise of Independent Director - Ms. Vijaya Latha Reddy
Announcement under Regulation 30 (LODR)-Newspaper Publication
16-Jul-2026 | Source : BSE38th Annual General Meeting and E-Voting
Corporate Actions

12 Aug 2026

ADC India Communications Ltd has declared 250% dividend, ex-date: 31 Jul 26

No Splits history available

No Bonus history available

No Rights history available
Quality key factors
Valuation key factors
Technicals key factors
 Technical Indicator Scale: Bearish, Mildly Bearish, Sideways, Mildly Bullish, Bullish Turned
 Shareholding Snapshot : Jun 2026
Shareholding Compare (%holding)
Promoters
None
Held by 0 Schemes
Held by 2 FIIs (0.09%)
Commscope Connectivity Llc (67.49%)
None
24.23%
Quarterly Results Snapshot (Standalone) - Mar'26 - QoQ

QoQ Growth in quarter ended Mar 2026 is 27.70% vs 4.84% in Dec 2025

QoQ Growth in quarter ended Mar 2026 is -42.74% vs 42.23% in Dec 2025
Half Yearly Results Snapshot (Standalone) - Sep'25
Growth in half year ended Sep 2025 is -8.57% vs 7.74% in Sep 2024
Growth in half year ended Sep 2025 is -40.18% vs 112.75% in Sep 2024
Nine Monthly Results Snapshot (Standalone) - Dec'25
YoY Growth in nine months ended Dec 2025 is -1.74% vs 5.25% in Dec 2024
YoY Growth in nine months ended Dec 2025 is -27.89% vs 56.44% in Dec 2024
Annual Results Snapshot (Standalone) - Mar'26
YoY Growth in year ended Mar 2026 is 6.96% vs 4.81% in Mar 2025
YoY Growth in year ended Mar 2026 is -22.61% vs 18.22% in Mar 2025
About ADC India Communications Ltd

Company Coordinates


