
Key Events This Week
1 June: Sharp decline in quarterly financial performance reported
2 June: Valuation metrics signal elevated risk amid market volatility
5 June: Week closes at Rs.0.51, up 2.00% vs Sensex down 0.78%
Jun 19, 03:30 PM
BSE+NSE Vol: 12.45 lacs
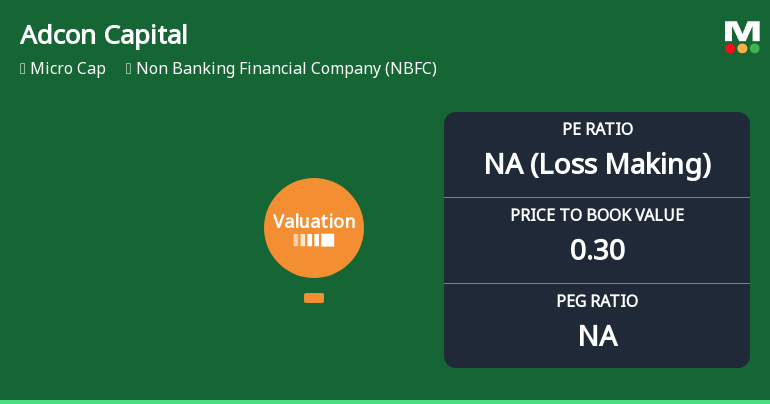
Non Banking Financial Company (NBFC)
INR 13 Cr (Micro Cap)
NA (Loss Making)
21
0.00%
0.00
-6.90%
0.46
Adcon Capital for the last several years.

1 June: Sharp decline in quarterly financial performance reported
2 June: Valuation metrics signal elevated risk amid market volatility
5 June: Week closes at Rs.0.51, up 2.00% vs Sensex down 0.78%
Adcon Capital Services Ltd, a micro-cap player in the Non Banking Financial Company (NBFC) sector, has experienced a marked shift in its valuation parameters, moving from a previously attractive stance to a risky profile. This change, coupled with a recent downgrade in its Mojo Grade to Strong Sell, highlights growing concerns about the company’s financial health and market positioning amid broader sectoral and market headwinds.
Read full news articleAdcon Capital Services Ltd's latest financial results for Q4 FY26 reveal significant operational challenges despite a notable increase in revenue. The company reported net sales of ₹2.21 crores, reflecting a quarter-on-quarter growth of 256.45% from ₹0.62 crores in Q3 FY26. However, this revenue surge was overshadowed by a substantial net loss of ₹2.98 crores, marking a stark contrast to the modest profit of ₹0.09 crores in the previous quarter. The operating profit before depreciation, interest, and tax (PBDIT) plummeted to negative ₹3.27 crores, resulting in an operating margin of negative 147.96%, a drastic decline from the positive margin of 96.77% in Q3 FY26. This indicates severe operational dysfunction, as the company incurred losses that far exceeded its revenue generation capabilities. Additionally, the interest burden increased by 33.33% quarter-on-quarter to ₹0.68 crores, contributing to the f...
Read full news articlePlease find the attached Newspaper Notice
Please find the attached Annual Secretarial Compliance Report
Please find the attached outcome of Board Meeting

No Upcoming Board Meetings

No Dividend history available

Adcon Capital Services Ltd has announced 1:10 stock split, ex-date: 12 Apr 22

No Bonus history available

Adcon Capital Services Ltd has announced 25:3 rights issue, ex-date: 02 Dec 22
 Technical Indicator Scale: Bearish, Mildly Bearish, Sideways, Mildly Bullish, Bullish Turned
 Non Institution
None
Held by 0 Schemes
Held by 0 FIIs
None
Anup Dattaram Patil (5.89%)
72.52%

QoQ Growth in quarter ended Mar 2026 is 256.45% vs -24.39% in Dec 2025

QoQ Growth in quarter ended Mar 2026 is -3,411.11% vs -67.86% in Dec 2025
Growth in half year ended Sep 2025 is -0.57% vs 97.75% in Sep 2024
Growth in half year ended Sep 2025 is -42.42% vs 149.06% in Sep 2024
YoY Growth in nine months ended Dec 2025 is 0.85% vs 80.77% in Dec 2024
YoY Growth in nine months ended Dec 2025 is -48.48% vs 150.00% in Dec 2024
YoY Growth in year ended Mar 2026 is 43.57% vs 89.88% in Mar 2025
YoY Growth in year ended Mar 2026 is -197.71% vs 336.00% in Mar 2025


