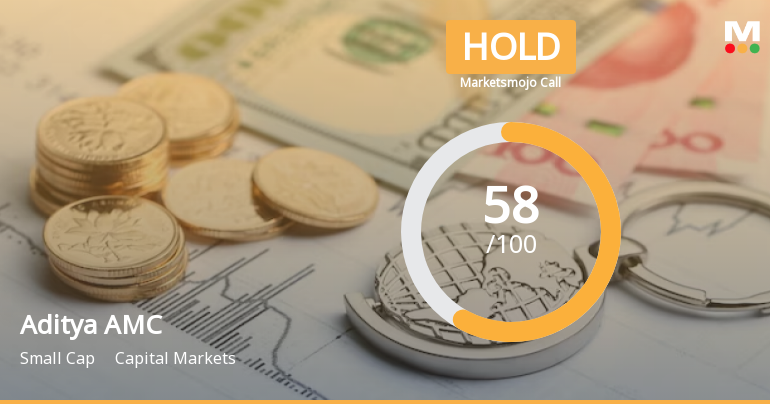
Aditya AMC

  • Market Cap: Small Cap
  • Industry: Capital Markets
  • ISIN: INE404A01024
  • NSEID: ABSLAMC
  • BSEID: 543374
INR
1,061.15
-29.5 (-2.7%)
BSENSE

Sep 18, 03:30 PM

BSE+NSE Vol: 4.0 lacs

  • Price Points
  • Score
  • Mojo Parameters
  • Total Return
  • News and Corporate Actions
  • Key factors
  • Shareholding
  • Financials
  • CompanyCV
stock-summaryPrice Point
High/Low

1Day

52 Week

Valuation
Technical
Day's Volume

CASH

4.0 lacs (28.18%) Volume

Shareholding (Jun 2026)

FII

4.41%

Held by 144 FIIs

DII

14.28%

Held by 30 DIIs

Promoter

74.71%

Why is Aditya Birla Sun Life AMC Ltd falling/rising?

06-Sep-2026

As of 05-Sep, Aditya Birla Sun Life AMC Ltd's stock price is rising, currently at 1,062.30, reflecting a strong performance with a year-to-date increase of 31.87% compared to a decline in the Sensex. The stock shows robust fundamentals and increasing institutional investor participation, indicating a positive outlook despite some short-term trading fluctuations.

As of 05-Sep, Aditya Birla Sun Life AMC Ltd's stock price is rising, currently at 1,062.30, reflecting a change of 17.2 (1.65%) upward. The stock has shown strong performance over various periods, with a 1-week increase of 1.39% and a notable 6.75% rise over the past month, significantly outperforming the Sensex, which has declined by 0.97% and 2.44% respectively during these periods. Year-to-date, the stock has surged by 31.87%, while the Sensex has fallen by 10.21%, indicating robust relative strength.<BR><BR>Today's performance is particularly noteworthy as the stock has outperformed its sector by 0.59% and has been on a consecutive gain streak for the last two days, accumulating a total return of 3.53% in this short span. The stock reached an intraday high of Rs 1065.95, marking a 2% increase. <BR><BR>Additionally, the stock benefits from strong long-term fundamentals, evidenced by an average Return on Equity (ROE) of 25.62%. There has also been increasing participation from institutional investors, who have raised their stake by 1.37% in the last quarter, now holding 18.7% of the company. This trend suggests confidence from investors with greater analytical resources, further supporting the stock's upward movement.<BR><BR>Despite a decline in delivery volume by 51.32% against the 5-day average, the stock remains liquid enough for trading, indicating that while there may be some short-term fluctuations in trading activity, the overall sentiment and performance metrics suggest a positive outlook for Aditya Birla Sun Life AMC Ltd.

View full answer

Who are in the management team of Aditya AMC?

01-Sep-2026

The management team of Aditya AMC includes A Balasubramanian (Managing Director & CEO), Sandeep Asthana, Alka Bharucha, Navin Puri, Hemanti Wadhwa, Ramesh Abhishek, Sunderrajan Raman, Amrit Kanwal, Vishakha Mulye, and Supratim Bandyopadhyay, bringing diverse expertise to the company.

The management team of Aditya AMC includes the following key members:<BR><BR>1. **A Balasubramanian** - Managing Director & CEO<BR>2. **Sandeep Asthana** - Non-Executive & Non-Independent Director<BR>3. **Alka Bharucha** - Non-Executive & Independent Director<BR>4. **Navin Puri** - Independent Director<BR>5. **Hemanti Wadhwa** - Company Secretary & Compliance Officer<BR>6. **Ramesh Abhishek** - Independent Director<BR>7. **Sunderrajan Raman** - Independent Director<BR>8. **Amrit Kanwal** - Director<BR>9. **Vishakha Mulye** - Director<BR>10. **Supratim Bandyopadhyay** - Independent Director<BR><BR>This diverse team brings a range of expertise and leadership to the company.

View full answer

What does Aditya AMC do?

01-Sep-2026

Aditya Birla Sun Life AMC Ltd is a small-cap company in the capital markets industry, offering asset management services since 1994. As of June 2026, it reported net sales of 463 Cr and a net profit of 309 Cr, with a market cap of INR 29,636 Cr.

Overview:<BR>Aditya Birla Sun Life AMC Ltd operates in the capital markets industry and is categorized as a small-cap company.<BR><BR>History:<BR>The company was originally incorporated as Birla Capital International AMC Limited in Mumbai on 05 September 1994 by the Aditya Birla Group and the Capital Group. It commenced operations with a Certificate for Commencement of Business dated 10 November 1994. The latest quarterly results reported are for June 2026.<BR><BR>Financial Snapshot:<BR>Net Sales: 463 Cr (Quarterly Results - Jun 2026) <BR>Net Profit: 309 Cr (Quarterly Results - Jun 2026) <BR>Market Cap: INR 29,636 Cr (Small Cap)<BR><BR>Key Metrics:<BR>P/E: 30.00 <BR>Industry P/E: 21 <BR>Dividend Yield: 2.43% <BR>Debt Equity: 0.02 <BR>Return on Equity: 24.18% <BR>Price to Book: 7.50 <BR><BR>Contact Details:<BR>Registrar Address: Not available. <BR>Phone: N/A <BR>Email: N/A <BR>Website: N/A

View full answer

Who are the peers of the Aditya AMC?

01-Sep-2026

Aditya AMC's peers include Motil.Oswal.Fin., 360 ONE, Anand Rathi Wealth, CRISIL, Nuvama Wealth, Angel One, Cams Services, NSDL, and KFin Technologies. In terms of performance, Anand Rathi Wealth leads with a 1-year return of 57.67%, while NSDL has the lowest at -34.39%; Aditya AMC's return is 26.03%.

Peers: The peers of Aditya AMC are Motil.Oswal.Fin., 360 ONE, Anand Rathi Wea., CRISIL, Nuvama Wealth, Angel One, Cams Services, N S D L, and KFin Technolog.<BR><BR>Quality Snapshot: Excellent management risk is observed at 360 ONE, Nuvama Wealth, Angel One, Cams Services, and KFin Technolog., while Good management risk is found at Motil.Oswal.Fin., Anand Rathi Wea., and Aditya AMC. Average management risk is noted at N S D L. For Growth, Excellent growth is seen at 360 ONE, Nuvama Wealth, Angel One, and KFin Technolog., while Good growth is reported by Motil.Oswal.Fin., Anand Rathi Wea., and Aditya AMC. Below Average growth is indicated for CRISIL and Cams Services. Average growth is found at N S D L. In terms of Capital Structure, Excellent ratings are given to all peers except for N S D L, which has an Average rating.<BR><BR>Return Snapshot: Anand Rathi Wea. has the highest 1-year return at 57.67%, while N S D L has the lowest at -34.39%. Aditya AMC's 1-year return of 26.03% is higher than N S D L's but lower than Anand Rathi Wea.'s. Additionally, N S D L is the only peer with a negative six-month return.

View full answer

How big is Aditya AMC?

01-Sep-2026

As of 31st August, Aditya Birla Sun Life AMC Ltd has a market capitalization of 29,636.00 Cr, with recent Net Sales of 1,860.59 Cr and a Net Profit of 1,007.44 Cr. Shareholder's Funds are valued at 4,041.66 Cr, and Total Assets amount to 4,415.43 Cr.

As of 31st August, Aditya Birla Sun Life AMC Ltd has a market capitalization of 29,636.00 Cr, categorizing it as a Small Cap company.<BR><BR>In the latest four quarters, the company reported Net Sales of 1,860.59 Cr and a Net Profit of 1,007.44 Cr.<BR><BR>For the latest annual period, the Shareholder's Funds were valued at 4,041.66 Cr, while the Total Assets amounted to 4,415.43 Cr.

View full answer

Are Aditya Birla Sun Life AMC Ltd latest results good or bad?

22-Jul-2026

Aditya Birla Sun Life AMC's latest results show a strong net profit increase of 65.41% quarter-on-quarter, but concerns arise from declining operating margins and rising employee costs, leading to a 6.82% drop in stock price. Overall, while profit growth is notable, operational challenges suggest caution for investors.

Aditya Birla Sun Life AMC's latest results present a mixed picture. On the positive side, the company reported a net profit of ₹309.49 crore for Q1 FY27, which is a significant increase of 65.41% compared to the previous quarter and an 11.68% rise year-on-year. Revenue also showed modest growth, increasing by 1.03% quarter-on-quarter and 3.48% year-on-year, reaching ₹462.96 crore.<BR><BR>However, there are notable concerns regarding the quality of these earnings. The operating margin, excluding other income, fell to 55.65%, marking the lowest level in seven quarters and reflecting a decline of 252 basis points from the previous quarter. This decline was largely driven by a sharp increase in employee costs, which rose by 11.39%, outpacing revenue growth.<BR><BR>Additionally, the substantial increase in net profit was heavily influenced by a surge in other income, raising questions about the sustainability of this profit growth. Following the results announcement, the stock price dropped by 6.82%, indicating investor concerns about the underlying operational performance despite the headline profit figures.<BR><BR>In summary, while the net profit growth appears strong, the operational challenges and margin compression suggest that the results may not be as favorable as they initially seem. Investors should be cautious and monitor future performance closely.

View full answer

Should I buy, sell or hold Aditya Birla Sun Life AMC Ltd?

22-Jul-2026

When is the next results date for Aditya Birla Sun Life AMC Ltd?

09-Jan-2026

The next results date for Aditya Birla Sun Life AMC Ltd is January 22, 2026.

The next results date for Aditya Birla Sun Life AMC Ltd is scheduled for January 22, 2026.

View full answer

Is Aditya AMC technically bullish or bearish?

03-Dec-2025

As of December 2, 2025, the technical trend is neutral with weak indicators, showing a shift from mildly bullish to sideways, as evidenced by bearish MACD readings and underperformance relative to the Sensex.

As of 2 December 2025, the technical trend has changed from mildly bullish to sideways. The current technical stance is neutral, with weak indicators across multiple time frames. The weekly MACD is bearish, and Bollinger Bands are also indicating a bearish trend. The monthly MACD is mildly bearish, while the KST shows a mixed signal with a bearish weekly stance and a bullish monthly stance. Moving averages on the daily chart are mildly bullish, but overall, the lack of strong signals from the RSI and the absence of trends in Dow Theory and OBV suggest a lack of momentum. The stock has underperformed relative to the Sensex over various periods, further indicating weakness.

View full answer

How has been the historical performance of Aditya AMC?

01-Dec-2025

Aditya AMC has shown consistent growth, with net sales increasing from 1,226.61 crore in March 2023 to 1,684.78 crore in March 2025, and a net profit rising to 930.60 crore. The company also experienced significant improvements in operating income, profit before tax, and cash flow, indicating a strong financial foundation.

Answer:<BR>The historical performance of Aditya AMC shows a consistent growth trend in net sales and profitability over the years, culminating in a net profit of 930.60 crore for the year ending March 2025.<BR><BR>Breakdown:<BR>Aditya AMC's net sales have increased significantly from 1,226.61 crore in March 2023 to 1,684.78 crore in March 2025, reflecting a strong upward trajectory. The total operating income followed suit, rising from 1,226.61 crore in March 2023 to 1,684.78 crore in March 2025. Operating profit, excluding other income, also saw a notable increase, reaching 988.97 crore in March 2025, up from 704.99 crore in March 2023. The profit before tax rose to 1,244.54 crore in March 2025, compared to 793.86 crore in March 2023, while the profit after tax reached 930.60 crore, up from 596.38 crore in the same period. The company's total assets grew from 2,788.13 crore in March 2023 to 4,114.43 crore in March 2025, indicating a solid expansion in its financial base. Total liabilities also increased, from 2,788.13 crore to 4,114.43 crore, but the absence of debt suggests a strong equity position. Cash flow from operating activities improved to 708 crore in March 2025 from 437 crore in March 2023, demonstrating enhanced operational efficiency. Overall, Aditya AMC's financial metrics indicate robust growth and a solid financial foundation over the observed years.

View full answer

Is Aditya AMC overvalued or undervalued?

28-Oct-2025

As of October 27, 2025, Aditya AMC is fairly valued with a PE ratio of 24.33, lower than Bajaj Finance and Bajaj Finserv, and has outperformed the Sensex with an 11.21% return over the past year.

As of 27 October 2025, the valuation grade for Aditya AMC has moved from very expensive to fair. The company is currently fairly valued based on its financial metrics. Key ratios include a PE ratio of 24.33, an EV to EBITDA of 21.14, and a Price to Book Value of 0.66, which suggest that the company's valuation is more aligned with its earnings and asset base compared to its previous status.<BR><BR>In comparison to peers, Aditya AMC's PE ratio is significantly lower than Bajaj Finance, which is very expensive at 38.72, and also lower than Bajaj Finserv at 36.44. Conversely, it is more favorable than Life Insurance, which has a PE of 11.65, indicating that while Aditya AMC is fairly valued, there are peers with both higher and lower valuations. Notably, Aditya AMC has outperformed the Sensex over the last year with a return of 11.21% compared to the Sensex's 6.77%, reinforcing its position in the market.

View full answer

Who are the top shareholders of the Aditya AMC?

17-Jul-2025

The top shareholder of Aditya AMC is Aditya Birla Capital Limited, with a 44.94% stake. Other significant shareholders include Life Insurance Corporation of India (3.44%), individual investors (7.07%), mutual fund schemes (5.74%), and foreign institutional investors (5.32%).

The top shareholders of Aditya AMC include several key players. The majority shareholder is Aditya Birla Capital Limited, holding a significant 44.94%. Other notable shareholders include Life Insurance Corporation of India, which holds 3.44%, and individual investors who collectively own 7.07%. Additionally, the company has 20 mutual fund schemes holding a combined 5.74%, and 128 foreign institutional investors (FIIs) with a total holding of 5.32%. There are no pledged promoter holdings reported.

View full answer

Has Aditya AMC declared dividend?

06-Jun-2025

Yes, Aditya Birla Sun Life AMC Ltd has declared a 270% dividend, amounting to ₹13.5 per share, with an ex-date of August 1, 2024. While recent returns have varied, the company has shown strong price growth over the 1- and 2-year periods.

Aditya Birla Sun Life AMC Ltd has declared a 270% dividend.<BR><BR>Dividend Details:<BR>- Percentage announced: 270%<BR>- Amount per share: 13.5<BR>- Ex-date: 01 Aug 24<BR><BR>Dividend Yield: 1.78%.<BR><BR>Total Returns by Period:<BR>In the 6-month period, the price return was -8.07%, with a dividend return of 0%, resulting in a total return of -8.07%.<BR><BR>For the 1-year period, the price return was 33.4%, the dividend return was 2.18%, leading to a total return of 35.58%.<BR><BR>Over the 2-year period, the price return was 109.4%, with a dividend return of 5.09%, culminating in a total return of 114.49%.<BR><BR>In the 3-year period, the price return was 88.93%, the dividend return was 7.38%, resulting in a total return of 96.31%.<BR><BR>For the 4-year period, there was no price return and no dividend return, resulting in a total return of 0.0%.<BR><BR>In the 5-year period, both price return and dividend return were 0%, leading to a total return of 0.0%.<BR><BR>Overall, Aditya Birla Sun Life AMC Ltd has declared a significant dividend, and while the recent returns show variability, the longer-term performance indicates strong growth in price returns, particularly over the 1 and 2-year periods.

View full answer
iScoreScore
Click here to find our call on this stock
Strong Sell
Sell
Hold
Buy
Strong Buy

Dashboard

1

Strong Long Term Fundamental Strength with an average Return on Equity (ROE) of 25.62%

 
2

Flat results in Jun 26

3

With ROE of 24.2, it has a Very Expensive valuation with a 7.6 Price to Book Value

4

Increasing Participation by Institutional Investors

5

Consistent Returns over the last 3 years

stock-summaryMojo Parameters

Mojo Parameters

Loading Valuation Snapshot...

Stock DNA

stock-summary
Industry

Capital Markets

stock-summary
Market cap

INR 31,948 Cr (Small Cap)

stock-summary
P/E

30.00

stock-summary
Industry P/E

20

stock-summary
Dividend Yield

2.34%

stock-summary
Debt Equity

0.02

stock-summary
Return on Equity

24.18%

stock-summary
Price to Book

7.80

Revenue and Profits:
Net Sales:
463 Cr
(Quarterly Results - Jun 2026)
Net Profit:
309 Cr
stock-summaryTotal Returns
Total Returns (Price + Dividend) stock-summary
Dividend Yield (2.34%)
TimePeriod
Price Return
Dividend Return
Total Return
3 Months
-9.04%
2.16%
-6.88%
6 Months
9.48%
2.87%
12.35%
1 Year
29.52%
3.14%
32.66%
2 Years
39.93%
6.89%
46.82%
3 Years
153.59%
14.41%
168.0%
4 Years
123.19%
16.45%
139.64%
5 Years
0%
12.37%
12.37%

Latest dividend: 25.5 per share ex-dividend date: Jul-22-2026

Risk Adjusted Returns v/s stock-summary
Returns Beta
Icon
Beta has not been calculated since enough price history is not available
stock-summaryNews & Corporate Actions

Announcements stock-summary

Announcement under Regulation 30 (LODR)-Analyst / Investor Meet - Intimation

16-Sep-2026 | Source : BSE

Aditya Birla Sun Life AMC Limited has informed the Exchange about the Schedule of the Investor Meeting.

Announcement under Regulation 30 (LODR)-Analyst / Investor Meet - Intimation

09-Sep-2026 | Source : BSE

Aditya Birla Sun Life AMC Limited has informed the Exchange about the Schedule of the Investor Meeting.

Announcement under Regulation 30 (LODR)-Credit Rating

03-Sep-2026 | Source : BSE

Disclosure regarding ESG Rating of the Company.

Corporate Actions stock-summary

stock-summary
BOARD MEETING

No Upcoming Board Meetings

stock-summary
DIVIDEND

Aditya Birla Sun Life AMC Ltd has declared 510% dividend, ex-date: 22 Jul 26

stock-summary
SPLITS

No Splits history available

stock-summary
BONUS

No Bonus history available

stock-summary
RIGHTS

No Rights history available

stock-summaryKey Factors

Quality key factors stock-summary

Factor
Value
Sales Growth (5y)
10.06%
EBIT Growth (5y)
10.96%
Net Debt to Equity (avg)
0.02
Institutional Holding
18.70%
ROE (avg)
25.62%

Valuation key factors

Factor
Value
P/E Ratio
30
Industry P/E
20
Price to Book Value
7.60
EV to EBIT
29.23
EV to EBITDA
27.94
EV to Capital Employed
7.72
EV to Sales
16.46
PEG Ratio
8.50
Dividend Yield
2.40%
ROCE (Latest)
26.70%
ROE (Latest)
24.18%

Technicals key factors

Indicator
Weekly
Monthly
MACD
Mildly Bearish
Bullish
RSI
No Signal
No Signal
Bollinger Bands
Bearish
Bullish
Moving Averages
Bullish (Daily)
KST
Mildly Bearish
Bullish
Dow Theory
Mildly Bullish
Mildly Bearish
OBV
Mildly Bullish
Mildly Bearish
stock-summary Technical Indicator Scale: Bearish, Mildly Bearish, Sideways, Mildly Bullish, Bullish  Turned 
stock-summaryShareholding
Shareholding Snapshot : Jun 2026stock-summary
Shareholding Compare (%holding) stock-summary
Majority shareholders

Promoters

Pledged Promoter Holdings

None

Mutual Funds

Held by 31 Schemes (9.38%)

FIIs

Held by 144 FIIs (4.41%)

Promoter with highest holding

Aditya Birla Capital Limited (44.83%)

Highest Public shareholder

Nippon India Mutual Fund (3.63%)

Individual Investors Holdings

5.26%

stock-summaryFinancial
[
  {
    "link": "quarterly",
    "btn_text": "All Quarterly Results",
    "header": "Quarterly Results Snapshot (Consolidated) - Jun'26 - QoQ",
    "rhs": [
      {
        "prefix": "Net Sales ",
        "suffix": "QoQ Growth in quarter ended Jun 2026 is 1.03% vs -4.15% in Mar 2026",
        "dir": 1
      },
      {
        "prefix": "Consolidated Net Profit ",
        "suffix": "QoQ Growth in quarter ended Jun 2026 is 65.41% vs -30.58% in Mar 2026",
        "dir": 1
      }
    ],
    "table": {
      "header": [
        "Jun'26",
        "Mar'26",
        "Change(%)"
      ],
      "body": [
        {
          "field": "Net Sales",
          "val1": "462.96",
          "val2": "458.23",
          "chgp": "1.03%",
          "chgp_class": "positive"
        },
        {
          "field": "Operating Profit (PBDIT) excl Other Income",
          "val1": "257.63",
          "val2": "266.42",
          "chgp": "-3.30%",
          "chgp_class": "negative"
        },
        {
          "field": "Interest",
          "val1": "1.13",
          "val2": "1.18",
          "chgp": "-4.24%",
          "chgp_class": "positive"
        },
        {
          "field": "Exceptional Items",
          "val1": "0.00",
          "val2": "0.00",
          "chgp": "",
          "chgp_class": "neutral"
        },
        {
          "field": "Consolidate Net Profit",
          "val1": "309.49",
          "val2": "187.11",
          "chgp": "65.41%",
          "chgp_class": "positive"
        },
        {
          "field": "Operating Profit Margin (Excl OI)",
          "val1": "55.65%",
          "val2": "58.14%",
          "chgp": "-2.49%",
          "chgp_class": "negative"
        }
      ]
    }
  },
  {
    "link": "half-yearly",
    "btn_text": "All Half Yearly Results",
    "header": "Half Yearly Results Snapshot (Consolidated) - Sep'25",
    "rhs": [
      {
        "prefix": "Net Sales ",
        "suffix": " Growth in half year ended Sep 2025 is 12.07% vs 25.49% in Sep 2024",
        "dir": -1
      },
      {
        "prefix": "Consolidated Net Profit ",
        "suffix": " Growth in half year ended Sep 2025 is 8.45% vs 31.82% in Sep 2024",
        "dir": -1
      }
    ],
    "table": {
      "header": [
        "Sep'25",
        "Sep'24",
        "Change(%)"
      ],
      "body": [
        {
          "field": "Net Sales",
          "val1": "908.71",
          "val2": "810.83",
          "chgp": "12.07%",
          "chgp_class": "positive"
        },
        {
          "field": "Operating Profit (PBDIT) excl Other Income",
          "val1": "548.55",
          "val2": "470.70",
          "chgp": "16.54%",
          "chgp_class": "positive"
        },
        {
          "field": "Interest",
          "val1": "2.59",
          "val2": "2.83",
          "chgp": "-8.48%",
          "chgp_class": "positive"
        },
        {
          "field": "Exceptional Items",
          "val1": "0.00",
          "val2": "0.00",
          "chgp": "",
          "chgp_class": "neutral"
        },
        {
          "field": "Consolidate Net Profit",
          "val1": "518.43",
          "val2": "478.05",
          "chgp": "8.45%",
          "chgp_class": "positive"
        },
        {
          "field": "Operating Profit Margin (Excl OI)",
          "val1": "60.37%",
          "val2": "58.05%",
          "chgp": "2.32%",
          "chgp_class": "positive"
        }
      ]
    }
  },
  {
    "link": "nine-monthly",
    "btn_text": "All Nine Monthly Results",
    "header": "Nine Monthly Results Snapshot (Consolidated) - Dec'25",
    "rhs": [
      {
        "prefix": "Net Sales ",
        "suffix": "YoY Growth in nine months ended Dec 2025 is 10.42% vs 27.17% in Dec 2024",
        "dir": -1
      },
      {
        "prefix": "Consolidated Net Profit ",
        "suffix": "YoY Growth in nine months ended Dec 2025 is 12.16% vs 22.82% in Dec 2024",
        "dir": -1
      }
    ],
    "table": {
      "header": [
        "Dec'25",
        "Dec'24",
        "Change(%)"
      ],
      "body": [
        {
          "field": "Net Sales",
          "val1": "1,386.79",
          "val2": "1,255.94",
          "chgp": "10.42%",
          "chgp_class": "positive"
        },
        {
          "field": "Operating Profit (PBDIT) excl Other Income",
          "val1": "838.25",
          "val2": "745.03",
          "chgp": "12.51%",
          "chgp_class": "positive"
        },
        {
          "field": "Interest",
          "val1": "3.83",
          "val2": "4.55",
          "chgp": "-15.82%",
          "chgp_class": "positive"
        },
        {
          "field": "Exceptional Items",
          "val1": "-2.82",
          "val2": "0.00",
          "chgp": "",
          "chgp_class": "neutral"
        },
        {
          "field": "Consolidate Net Profit",
          "val1": "787.95",
          "val2": "702.52",
          "chgp": "12.16%",
          "chgp_class": "positive"
        },
        {
          "field": "Operating Profit Margin (Excl OI)",
          "val1": "60.45%",
          "val2": "59.32%",
          "chgp": "1.13%",
          "chgp_class": "positive"
        }
      ]
    }
  },
  {
    "link": "annual",
    "btn_text": "All Annual Results",
    "header": "Annual Results Snapshot (Consolidated) - Mar'26",
    "rhs": [
      {
        "prefix": "Net Sales ",
        "suffix": "YoY Growth in year ended Mar 2026 is 9.51% vs 24.50% in Mar 2025",
        "dir": -1
      },
      {
        "prefix": "Consolidated Net Profit ",
        "suffix": "YoY Growth in year ended Mar 2026 is 4.78% vs 19.25% in Mar 2025",
        "dir": -1
      }
    ],
    "table": {
      "header": [
        "Mar'26",
        "Mar'25",
        "Change(%)"
      ],
      "body": [
        {
          "field": "Net Sales",
          "val1": "1,845.03",
          "val2": "1,684.78",
          "chgp": "9.51%",
          "chgp_class": "positive"
        },
        {
          "field": "Operating Profit (PBDIT) excl Other Income",
          "val1": "1,104.69",
          "val2": "988.97",
          "chgp": "11.70%",
          "chgp_class": "positive"
        },
        {
          "field": "Interest",
          "val1": "5.01",
          "val2": "5.66",
          "chgp": "-11.48%",
          "chgp_class": "positive"
        },
        {
          "field": "Exceptional Items",
          "val1": "-2.82",
          "val2": "0.00",
          "chgp": "",
          "chgp_class": "neutral"
        },
        {
          "field": "Consolidate Net Profit",
          "val1": "975.07",
          "val2": "930.60",
          "chgp": "4.78%",
          "chgp_class": "positive"
        },
        {
          "field": "Operating Profit Margin (Excl OI)",
          "val1": "59.87%",
          "val2": "58.70%",
          "chgp": "1.17%",
          "chgp_class": "positive"
        }
      ]
    }
  }
]

Quarterly Results Snapshot (Consolidated) - Jun'26 - QoQstock-summary

Jun'26
Mar'26
Change(%)
Net Sales
462.96
458.23
1.03%
Operating Profit (PBDIT) excl Other Income
257.63
266.42
-3.30%
Interest
1.13
1.18
-4.24%
Exceptional Items
0.00
0.00
Consolidate Net Profit
309.49
187.11
65.41%
Operating Profit Margin (Excl OI)
55.65%
58.14%
-2.49%
Values in Rs Cr.
Direction Arrows
Net Sales

QoQ Growth in quarter ended Jun 2026 is 1.03% vs -4.15% in Mar 2026

Direction Arrows
Consolidated Net Profit

QoQ Growth in quarter ended Jun 2026 is 65.41% vs -30.58% in Mar 2026

Half Yearly Results Snapshot (Consolidated) - Sep'25stock-summary

Sep'25
Sep'24
Change(%)
Net Sales
908.71
810.83
12.07%
Operating Profit (PBDIT) excl Other Income
548.55
470.70
16.54%
Interest
2.59
2.83
-8.48%
Exceptional Items
0.00
0.00
Consolidate Net Profit
518.43
478.05
8.45%
Operating Profit Margin (Excl OI)
60.37%
58.05%
2.32%
Values in Rs Cr.
Direction Arrows
Net Sales

Growth in half year ended Sep 2025 is 12.07% vs 25.49% in Sep 2024

Direction Arrows
Consolidated Net Profit

Growth in half year ended Sep 2025 is 8.45% vs 31.82% in Sep 2024

Nine Monthly Results Snapshot (Consolidated) - Dec'25stock-summary

Dec'25
Dec'24
Change(%)
Net Sales
1,386.79
1,255.94
10.42%
Operating Profit (PBDIT) excl Other Income
838.25
745.03
12.51%
Interest
3.83
4.55
-15.82%
Exceptional Items
-2.82
0.00
Consolidate Net Profit
787.95
702.52
12.16%
Operating Profit Margin (Excl OI)
60.45%
59.32%
1.13%
Values in Rs Cr.
Direction Arrows
Net Sales

YoY Growth in nine months ended Dec 2025 is 10.42% vs 27.17% in Dec 2024

Direction Arrows
Consolidated Net Profit

YoY Growth in nine months ended Dec 2025 is 12.16% vs 22.82% in Dec 2024

Annual Results Snapshot (Consolidated) - Mar'26stock-summary

Mar'26
Mar'25
Change(%)
Net Sales
1,845.03
1,684.78
9.51%
Operating Profit (PBDIT) excl Other Income
1,104.69
988.97
11.70%
Interest
5.01
5.66
-11.48%
Exceptional Items
-2.82
0.00
Consolidate Net Profit
975.07
930.60
4.78%
Operating Profit Margin (Excl OI)
59.87%
58.70%
1.17%
Values in Rs Cr.
Direction Arrows
Net Sales

YoY Growth in year ended Mar 2026 is 9.51% vs 24.50% in Mar 2025

Direction Arrows
Consolidated Net Profit

YoY Growth in year ended Mar 2026 is 4.78% vs 19.25% in Mar 2025

stock-summaryCompany CV
About Aditya Birla Sun Life AMC Ltd stock-summary
stock-summary
Aditya Birla Sun Life AMC Ltd
Small Cap
Capital Markets
Aditya Birla Sun Life AMC Limited (ABSLAMC) was originally incorporated as `Birla Capital International AMC Limited' at Mumbai as Public Company on 05 September 1994 by the Aditya Birla Group and the Capital Group. The Company commenced operations with Certificate for Commencement of Business dated 10 November 1994.
Company Coordinates stock-summary
Icon
No Company Details Available